How the Mad Hedge Market Timing Algorithm Tripled My Performance
I couldn’t believe my eyes.
Upon analyzing my performance data for the past year, it couldn’t be clearer.
After three years of battle testing, the algorithm has earned its stripes. I started posting it at the top of every newsletter and Trade Alert last year and will continue to do so in the future.
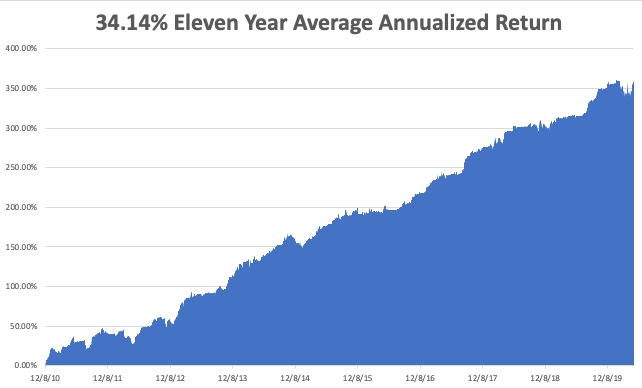
Once I implemented my proprietary Mad Hedge Market Timing Index in October 2016, the average annualized performance of my Trade Alert service has soared to an eye-popping 34.14%.
As a result, new subscribers have been beating down the doors trying to get in.
Let me list the highpoints of having a friendly algorithm looking over your shoulder on every trade.
*Algorithms have become so dominant in the market, accounting for up to 80% of total trading volume, that you should never trade without one
*It does the work of a seasoned 100-man research department in seconds
*It runs real-time and optimizes returns with the addition of every new data point far faster than any human can. Imagine a trading strategy that updates itself 30 times a day!
*It is artificial intelligence-driven and self-learning.
*Don’t go to a gunfight with a knife. If you are trading against algos alone,
you WILL lose!
*Algorithms provide you with a defined systematic trading discipline that will enhance your profits.
And here’s the amazing thing. My Mad Hedge Market Timing Index correctly predicted the outcome of the presidential election, while I got it dead wrong.
You saw this in stocks like US Steel, which took off like a scalded chimp the week before the election.
When my and the Market Timing Index’s views sharply diverge, I go into cash rather than bet against it.
Since then, my Trade Alert performance has been on an absolute tear. In 2017, we earned an eye-popping 57.39%. In 2018, I clocked 23.67% while the Dow Average was down 8%, a beat of 31%. In 2019, I clocked a blockbuster 56%
Here are just a handful of some of the elements which the Mad Hedge Market Timing Index analysis in real-time, 24/7.
50 and 200-day moving averages across all markets and industries
The Volatility Index (VIX)
The junk bond (JNK)/US Treasury bond spread (TLT)
Stocks hitting 52-day highs versus 52-day lows
McClellan Volume Summation Index
20-day stock bond performance spread
5-day put/call ratio
Stocks with rising versus falling volume
Relative Strength Indicator
12-month US GDP Trend
Case Shiller S&P 500 National Home Price Index
Of course, the Trade Alert service is not entirely algorithm-driven. It is just one tool to use among many others.
Yes, 50 years of experience trading the markets is still worth quite a lot.
I plan to constantly revise and upgrade the algorithm that drives the Mad Hedge Market Timing Index continuously, as new data sets become available.
Obviously, in light of the recent stock market crash, a ton of new valuable data is available for which my algo can mine.


