December 20, 2013 - MDT - Midday Missive
While the Diary of a Mad Hedge Fund Trader focuses on investment over a one week to six-month time frame, Mad Day Trader, provided by Jim Parker, will exploit money-making opportunities over a brief ten minute to three day window. It is ideally suited for day traders, but can also be used by long-term investors to improve market timing for entry and exit points.
Food for thought.
We sent out a few charts that bear watching this A.M.
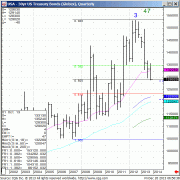
I'm looking for a wiggle up in the 30 yr. Bonds. I'm also looking to sell the first 1 1/2 point rally expecting price rejection the first time up.
Can this wiggle turn into something bigger?
SPU/Bonds are getting close to the 2007 high.
Everyone is one way again and loaded to the gills.
You're starting to see profit taking in the Yield curve steepeners.
( short the long end of the curve " 30 Yr." vs. Long the 2's & 5's.
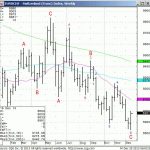
Currencies get propelled by interest rate differentials.
TLT...shows the possibility of bottoming down here, however I have to dig deeper into the 30 Yr. for confirmation.
You have to defer to the 30 yr. Futures not the ETF's!
ETF's don't lead, they follow.
A wiggle up in the 30 yr. could see us get filled on shorting the Currencies.
TBT... looks the polar opposite of the TLT, showing this is just the start of a longer term rise in rates.
Closing above 130.25 in the 30 Yr. Futures would signal a rally in the Long end of the curve.
This bears watching over the next week.
Short term Bond traders should look to buy the breaks down here before you sell.?
TBT traders would be looking for a break to buy.
Just be aware of the patterns and be patient.
For Glossary of terms and abbreviations click here.


