Three Charts That Will Turn the Markets
I wrote at length yesterday about why this is not a new bear market, but a traditional 7%-10% correction instead. Now, I?ll show you three charts that will call the exact turnaround.
The ten-year Treasury bond (TLT), (TBT) is clearly the lead contract. It has, far and away, been the most accurate in anticipating the future direction of all asset classes. Get this one right, and everything else falls into line.
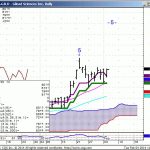
Take a look at the chart for the (TLT) below, which has clearly broken the 200 day moving average. I think that this is a false breakout, and that we are not trading in a new $108-$112 trading range that prevailed last spring. Note that while the 200-day average is busted, the 200-week is still putting up fierce resistance. This may well be the line in the sand that counts.
Next, take a look at the chart for the Japanese yen (FXY), (YCS). This is crucial because the yen is the world?s funding currency, thanks to its zero interest rates. When traders are in ?RISK OFF? MODE, they dump their positions in all asset classes and buy yen to repay their broker loans. This forces the yen to appreciate against the US dollar, something the Japanese government is loathe to seeing. This occurs on a scale of trillions of dollars.
When investors throw caution to the wind and pile back into ?RISK ON? portfolios, the reverse happens. They borrow yen and sell them to finance new positions, sending the yen down. Weakness in the yen is therefore the first place you will see a recovery in global markets.
The yen chart bellows shows that it is taking a run at its 200 day moving average at $97.91. That is only $1.70 up from here, and in line with ?100 to the dollar in the cash market, another important resistance level.
My expectation is that the yen will fail here and return to its longer-term downtrend, bringing a major 6% rally against the greenback to an end. That will send a great flashing green light to traders that the buyers strike is over and that its time to get back to work.
You see a very similar inverse chart with the S&P 500 (SPX). The bottom here also appears to be the 200 day moving average at 1,708, a mere 32 points below today?s low. That is only one bad day away. Watch for a rally from here to trigger simultaneous sell offs in the Treasury bond and yen markets.
You can play this game all day long. A confirming move of a top in interest rates would be a big rally in bank shares, which need higher interest rates to make more money. So keep a laser focus on Bank of America (BAC) and Citigroup (C). At the same time, gold (GLD) will once again get thrown out with the trash, since higher rates punish holders here with a greater opportunity cost.
This all may happen sooner than you think. The Friday January nonfarm payroll neatly sets up a double top in the volatility index at $21. Get a good number, like over 200,000, and see substantial back month revisions up, and volatility will collapse back to the mid teens. Everything else I described above will come to pass.
However, I won?t find out what transpired until Saturday. When the Department of Labor releases the anxiously awaited report, I should be fast asleep in my first class cabin somewhere over French Polynesia on my way to New Zealand. Send me an email on what happens.


