February 23, 2011 - The S&P 500 is Cruising for a Bruising
Featured Trades: (S&P 500 IS CRUISING FOR A BRUISING)
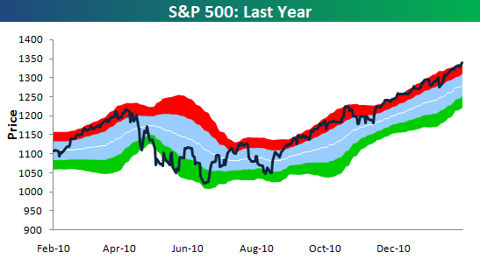
2) The S&P 500 is Cruising for a Bruising.? How overbought is the stock market? My friends at the Bespoke Investment Group produced this chart of the S&P 500 showing that it has remained in nosebleed territory for nearly six months now, except for a few fleeting months in November. This is why many hedge fund managers have been tearing their hair out, become addicted to Maalox, or are contemplating going into the restaurant business, especially if they have been playing from the short side for the past six months. It has been such a straight line move that it hasn't allowed many traders in.
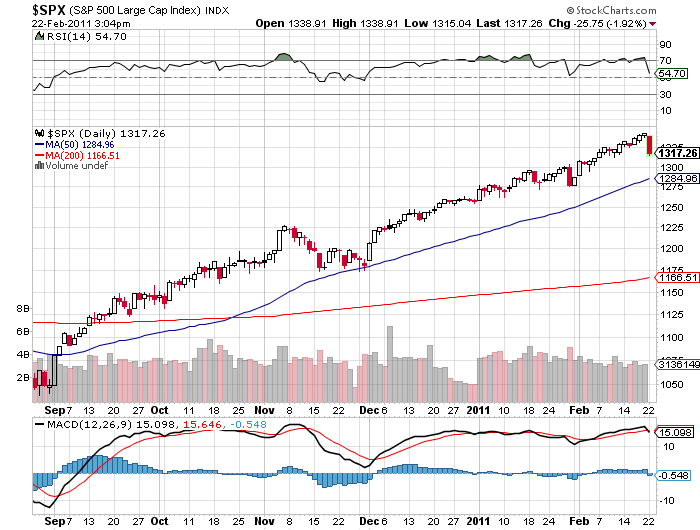
The light blue area in the chart represents one standard deviation above or below the 50 day moving average, which yesterday was at 1,284.? The red area shows where the market is more than one standard deviation above the average, while the green is more than one standard deviation below. Not only that, each individual sector in the (SPX) is overbought, with consumer discretionary, materials, and energy the most overbought.
Just to reach the nearest oversold area, the market has to drop to 1,240, down 100 points, or 7.5% from last night's close. Just thought you'd like to know.

-
-


