February 24, 2011 - How Far Will the Market Fall?
Featured Trades: (HOW FAR WILL THE MARKETS FALL?), (VIX), (SPX), (SPY)
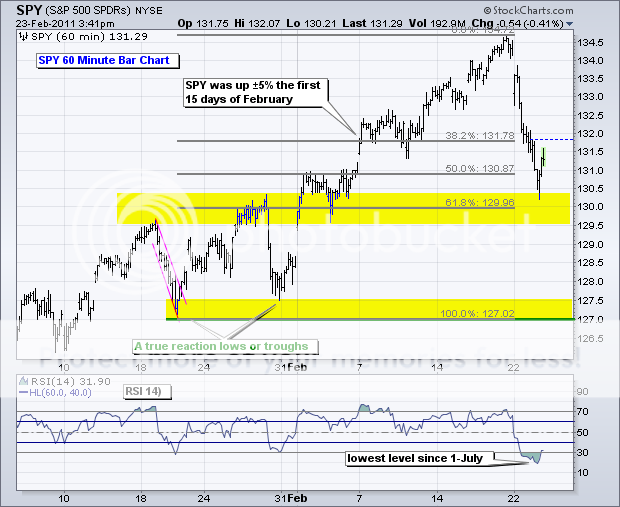
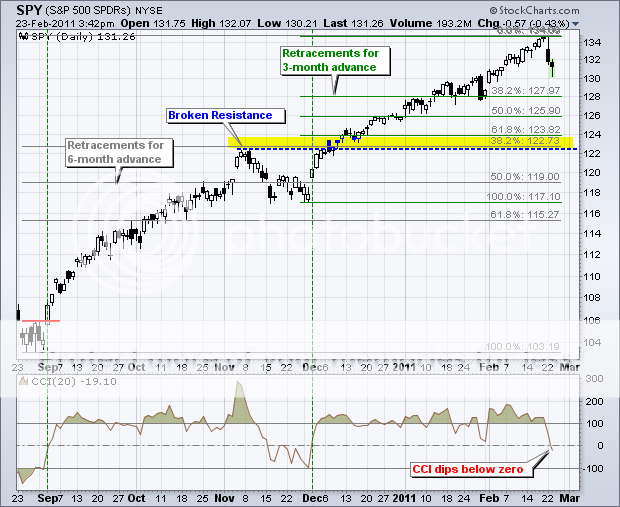
2) How Far Will the Market Fall? Now that we are solidly in 'RISK OFF' mode, traders, managers, and investors are asking how much downside we are looking at. It is safe to say that those who were piling on longs with reckless abandon are now potentially staring into the depths of a great chasm. I have included charts below showing the important Fibonacci support levels. Let's take a look at how far down is down.
*1,300 '? The first big figure. Already broken intraday, but it held the first time.
*1,286 '? The 50 day moving average, the no brainer, most bullish target. The 'buy the dip' crowd takes a first bite here.
*1,280 '? 38.2% Fibonacci support level.
*1,260 '? 50% Fibonacci support level.
*1,230 '? Broken resistance from the November high. Europe blows up again. Take your pick: Spain, Ireland, Britain, Portugal'?
*1,167 '? The 200 day moving average. It must hold for the bull market to stay intact. This is where $5/gallon takes us. Double dip recession talk reemerges. The 'buy the dip' crowd takes a second bite.
*1,117 '? The November low. The 'buy the dip' crowd throws up on its shoes and pukes out the last two 'buys'. We spike down, triggering another 'flash crash.'
*1,000 '? The next really big figure. Ben Bernanke, with the greatest reluctance, announces QE3. Bond prices soar, taking ten year yields to 2%. Homes prices collapse again, triggering a secondary banking crisis.
*666 '? The Saudi regime falls, and 12 million barrels a day disappears from the market for the indefinite future. Unemployment hits 15%. Obama is toast. Your broker turns bearish and tells you to sell everything. Welcome to the Great Depression II. It starts raining frogs.

-
-
But Will He Bounce?


