May 27, 2011 - The Battle of the 100 Day Moving Average
Featured Trades: (THE BATTLE OF THE 100 DAY MOVING AVERAGE)
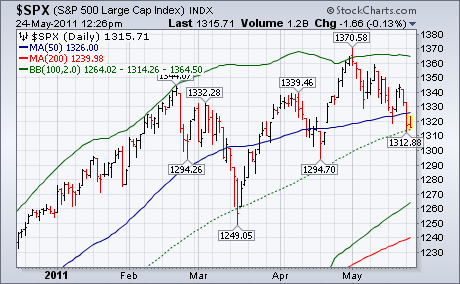
2) The Battle of the 100 Day Moving Average. Take a look at the chart below from StockCharts.com and it is clear that the line in the sand for the stock market is the 100 day moving average at 1,312.
I have noticed an interesting pattern that trading has fallen into since stocks peaked on April 29. All year, the Monday action indicated the medium term direction of the market. For the first four months, that brought rising stocks more than 90% of the time. For the past month, Mondays of delivered falling stocks like clockwork.
The indexes then bring in a few days of indecisive, double digit, low volume rallies. Next, a big risk off trade hits on Friday as short term traders clear the books for the weekend. The weekend press then produces some new bomb shells from Europe plus a lot of handwringing from domestic analysts that severely beat up stocks on Monday morning. That is then the low for the week.
If the 100 day moving average breaks then look out below, because the 'RISK OFF' trade will then continue all the way up until QE2 ends on June 30. The next support becomes the 200 day average at 1,240, or down 75 points from here. If it doesn't break, then it won't. Just thought you'd like to know.

-

