June 13, 2014 - MDT - Pro Tips A.M.
While the Diary of a Mad Hedge Fund Trader focuses on investment over a one week to six-month time frame, Mad Day Trader, provided by Jim Parker, will exploit money-making opportunities over a brief ten minute to three day window. It is ideally suited for day traders, but can also be used by long-term investors to improve market timing for entry and exit points.
Current Positions
Short Euro??????????????? 136.31????????? 136.85 GTC
.......................................................................................
Today's Working Orders
BUY Euro @ 133.75 OCO 136.85 Stop GTC ( Good Until Canceled)
.......................................................................................
It's Friday the 13th with Full Moon Fever.
"Stand my ground, I won't back down" (Tom Petty...Album... Full Moon Fever.)
"I know what's right and I won't back down"
The Bulls will have their work cut out for them
"Hey baby" this will be blaring all day long on my iMac!
?
Stocks...
Nasd 100...(M) minimally needs price recovery over 3780 to retest the high. Price action below 3754 could lead to a deeper correction.
DAX...1st support is 9860-80
USO...the monthly buy stops are above 39.54. 38.20 is support.
?
Bonds...
30 Yr. Bonds (M)...137.02 is near resistance and the upside pivot.
?
FX...
GBP/USD...put up a huge print just after the NYSE close when it rallied a full figure against the Euro. There is room for this to continue it's rally against the Euro into Monday.
?
Commodities...
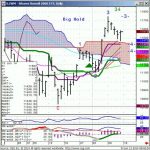
Oil...ran the next set of buy stops above @ 107.17. 112.24 is the next level I'm looking for. As Long as 106.30 holds, keep buying the breaks.
It's the summer in the desert. The Oil Sheiks are in Geneva Hotels, escaping the desert heat, with their family on one floor and their Russian mistresses on another.
I'm trotting out my favorite summer tgt. 116.50 for front month OIL.
One of these summers we'll print it.
Gold...above 1274, 1286-89 is the next mvg avg resistance level.
General Comments orValuable Insight
Every picture tells a story.
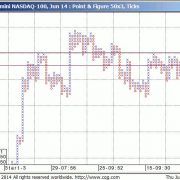
The long term Nasdaq Point & Figure is worth monitoring.
It shows an unrelenting, rip your face off, rally from the May 14th low of 3545 to yesterday's 3806.50 high.
That's the first chink in the armor in 250 NASDAQ points.
It's now vulnerable for a much lower retrace as long as there is no price recovery over 3780.
I don't roll to Sept Futures #'s In the Bonds or Equity Indices until next week.
Opening Range Time Frame Trading again today.
?
Short Term View...
Keep trading to make money. The opportunity will be in individual names.
Individual stocks look to be an easier read based off their own technical's.
For Medium Term Outlook click here.
For Glossary of terms and abbreviations click here.


