Don?t Be Short China Here
Everyone who has been reading this letter for the past eight years (yes, there are quite a few of you), know that I am a fundamentalist first and a technician second.
Of course you need to use both, as those who mistakenly leave one tool in the bag reliably underperform indexes.
The one liner here is that I use fundamentals to identify broad, long term, even epochal trends, and technicals for the short-term timing of my Trade Alerts.
Do both well, and you will prosper mightily.
Strategists often like to cloak themselves in the fundamental or technical mantle. But parse their words carefully, and the best fundamentalists talk about support and resistance levels, while the ace technicians refer to the latest economic data points.
The reality is that the best of the best are using both all the time. The differential titles have more to do with marketing purposes than anything else.
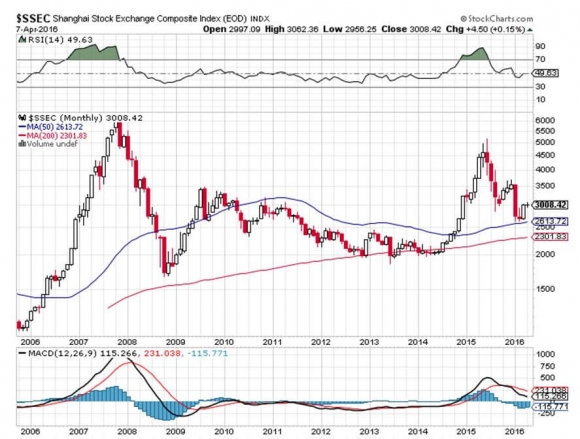
Having said all that, you better take a good, hard look at the chart below for the Shanghai Stock Exchange Composite Index ($SSEC). This is a classic narrowing triangle spread over the entire five years of the Chinese bear market that is imminently going to explode one way or the other.
My bet is that it resolves to the upside. All it would be doing then is coming in line with the rest of the global equity markets, including those of many emerging markets.
Since the top, the earnings multiple of Chinese companies have plunged, from 35 times to a mere 15 times. This means that the 6% a year growing economy (China) is trading at a lower multiple than the 2% a year growing one (the US). The big question among strategists since 2009 has been how far these valuations would diverge.
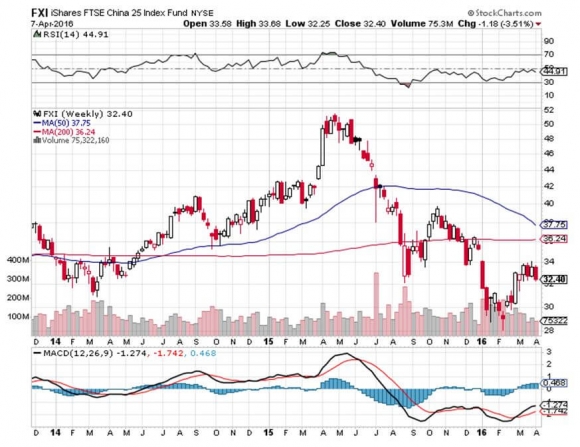
If I am right, then you can expect a rally of at least 25% in the Shanghai market soon, and more in peripheral markets, like Hong Kong (EWH) and in single Chinese names.
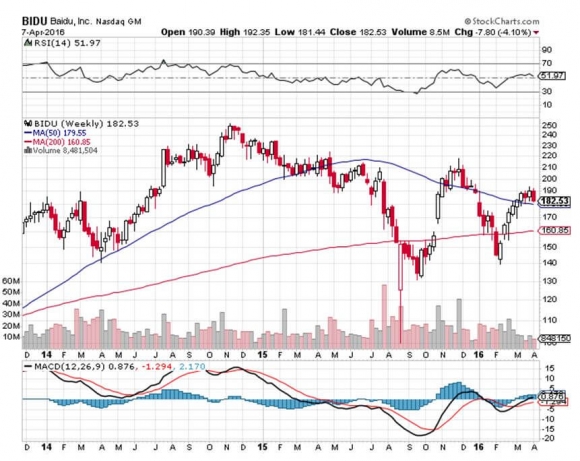
The rally will also place a laser like focus on the Chinese Internet sector, so you won?t go wrong picking up some Baidu (BIDU) around $180, if you can get it.? I originally recommended buying the stock at $12 seven years ago.
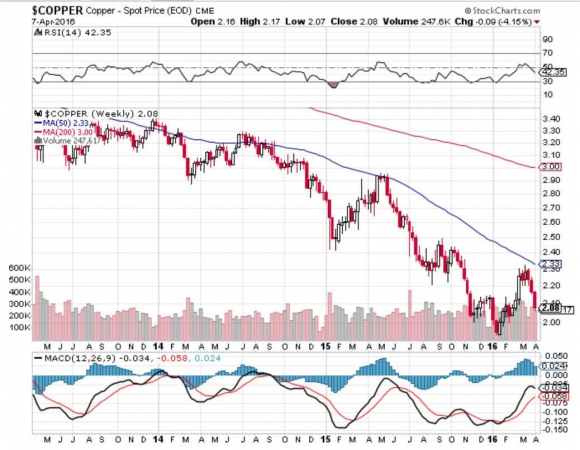
If you are looking for further confirmation of the coming bull move in China across asset classes, please peruse the chart below for copper. The red metal has one of the closest correlations out there with the fate of the Middle Kingdom?s economy and stock markets. It appears to be breaking out of a major three-year downtrend as well.
The other nice thing about this scenario is that it provides more fodder for my expectation of another global bull market move in the fall, when you can expect major indexes to tack on another 5% by yearend.
Jim Chanos, watch your back!


