August 9, 2011 - Why I've Been Wrong About the Market
Featured Trades: (WHY I'VE BEEN WRONG ON THE MARKET), (SPX)
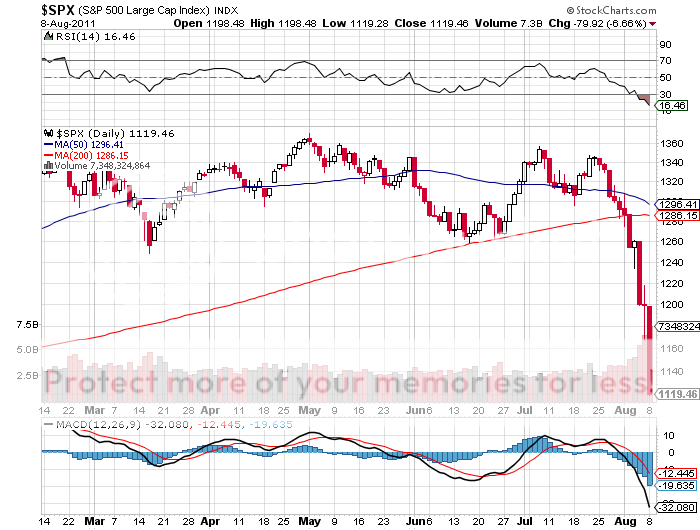
3) Why I've Been Wrong About the Market. On Friday I was fairly convinced that we are close to a bottom in the market at 1,166. As I write this the next day, I am staring at the (SPX) futures ticking down to 1,114.60.
I have been following global financial markets since the late sixties, and at my current advanced age, I don't get surprised very often. But I have to tell you that the 20.4%, 235 point plunge over the last two weeks has been a shocker. It is one of the most out of the blue moves that I have every seen, like the Kennedy assassination in 1963, Japan's overnight rebalancing of 50% of the Nikkei Index in 2,000, or 9-11 in 2001.
The recent market action reminds me of the mathematics of wave action in an Oceanography class that I took long ago. Several random, independent events coming from different sources a combining to amplify each other. The end result is a selling tsunami.
Of course, the finger prints of the high frequency traders are all over this move. Their computer algorithms flick billions in capital around to take profits measured in pennies and held for microseconds, arbitraging between exchange mainframes. The wider the spreads, the more of this kind of capital gets sucked into the market, the bigger and more violent the market moves. Spreads are now at 2 ? year highs, hence the 600 point daily ranges.
I have been warning readers all year that the risk of a flash crash was high. There is a reason why the flash crashes are always to the downside. We don't see flash melt ups. After a doubling of the equity indexes since 2009, it is the only natural move from a purely mathematical point of view.
The problem for you and I is that this kind of trading renders traditional market tools useless, like fundamental technical analysis useless, at least for the short term. You might as well take your income and balance sheet analysis, McClellan oscillators, and RSI's and throw them in the garbage can.
A rogue computer doesn't care that the price earnings multiple for the S&P 500 is a bargain at 12 times, and that you should get some sort of support at appropriate Fibonacci levels. While you usually see a battle fought around a 50 and 200 day moving averages that can last days or weeks, the market this time traded like they weren't there at all.
The only protection from this is to completely bail on the market and go into cash. This is why my cash positions have been running at the 80%-90% level in recent months, versus a 150% long portfolio last November. It is also why I have not been doubling up on the downside. Better to live to fight another day than lean against the Titanic.
-
There Goes My Research


