So What?s Next for the Markets?
I am writing to you from the bar of the El-Minzah Hotel in Tangiers, Morocco, a one-time favorite of literary greats, F. Scott Fitzgerald, Earnest Hemingway, and Paul Bowls.
A warm, languid breeze coming off the Atlantic Ocean is causing the date palms around the pool to sway in rhythmic fashion.
The city has long been a hotbed of espionage, international intrigue, and illicit trade. It was once home of the Barbary Pirates.
I first came here in 1968 and slept on the roof of a run down medina inn for 50 cents a night and thought it was the deal of the century.
How times change.
If you recognize the place from the pictures below, there?s a good reason. It is the location on which Rick?s Caf? Americain was based in the 1942 Humphrey Bogart film classic, Casablanca, complete with a grand piano.
Damn, and I already sent my white dinner jacket home!
Whenever I check into a hotel with decent broadband or WiFi, I undertake the same ritual drill. It is a practice born of a half century of analyzing markets.
I go to the ever-trustworthy www.stockcharts.com and rapidly run through 100 charts among all asset classes. This immediately gives me an instant snapshot of the global economy, and where to find the action in financial markets.
And what I?m finding today is nothing less than astounding.
On the one hand, a very impressive collapse of all energy, commodity, and precious metal prices suggests that we have already fallen into the morass of a severe recession.
On the other, some 77% of US companies beat forecasts for Q2 earnings and are painting a rosy picture of the future, confirming that the moderate economic recovery still has legs.
Which asset class has it right, and which one is missing the target?
I?ll go with the expansion scenario. I think that the stock market crash in the former Red China is sending us all schools of red herrings on the prediction front.
Middle Kingdom margin calls are triggering capitulation sell offs across the commodities board, leading to fears that the woes of newbie stock speculators will feed into the main economy. This, in turn, will prompt a global recession.
I don?t think this will happen. Rampant stock speculation was engaged in by only 4% of the population, with most of the gains confined to a couple of months.
Most of this was mere paper gains that went as quickly as they came. Thankfully, this was not a decade long build up, like the one we saw in NASDAQ during the 1990?s, which would have been far more damaging.
Furthermore, the government in Beijing is doing everything they can to prevent the collapse from going systemic. I think they will succeed. Only 3% of listed Chinese shares are now freely tradable.
The creation of financial markets from scratch for a major economy, which the Chinese are now attempting to engineer, was never going to be easy. I know, because I went through this with Japan 40 years ago.
Everything else that could have gone wrong this year, Iran, Greece, the Supreme Court decision on Obamacare, the Ukraine crisis, Iraq, has now passed us by, all resolving for the positive, as far as stock markets are concerned.
We have run out of things that could go wrong. A possible ?% Fed interest rate rise in September is so insignificant that it doesn?t even show up on the radar.
So it?s simple. Wait for the Chinese stock bubble to unwind, and then load the boat with global equities.
Except that it?s not that simple.
The US equity markets have been so boring this year that it is creating a situation that is unprecedented in the history of technical analysis. Volatility is now at a staggering 100 year low.
According to the Wall Street Journal, only six stocks, Amazon (AMZN), Google (GOOG), Apple (AAPL), Facebook (FB), Gilead Sciences (GILD), and Walt Disney (DIS) have accounted for more than the entire $199 billion in gains in the S&P 500 this year.
The other 494 stocks in the big cap index have, for the most part, been unchanged, or are losers.
I am proud to say that four of these six, (GOOG), (AAPL), (GILD), and (DIS) have been the subject of successful Trade Alerts or bullish research reports in this newsletter.
That?s not a bad home run record. Just go to www.madhedgefundtrader.com a search for the reports.
The situation is nearly as dire with the NASDAQ (QQQ), where the same stocks account for half of the $664 billion in gains there.
To long in the tooth traders, such as myself, a technical set up like this against falling volume this isn?t just a red warning light. It is an entire Christmas tree?s worth of warning lights.
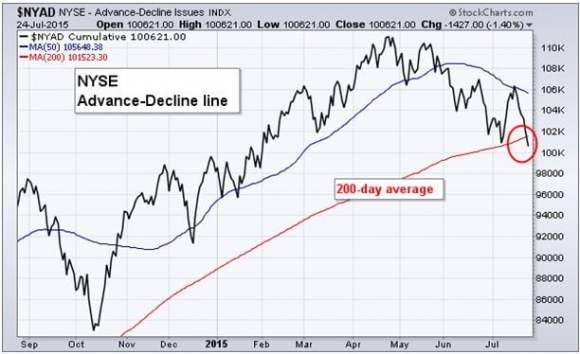
You can see this in all its eloquence in the chart below of a declining advance/decline ratio, which broke its 200-day moving average on Friday.
This is why I shot out a Trade Alert last week to bail on my ?RISK ON? short position in the Japanese yen (FXY) and to sell short the (SPY).
Now here is the really scary part. All of this is setting up going into the two highest risk months of the year, September and October, from which the legendary stock crashes of old spring.
In other words, the calendar couldn?t be worse for traders.
So here is the bottom line. Positive fundamentals have been checkmated by negative technicals. So we may go nowhere for a while, until corporate earnings catch up with share prices and make them look cheap once again.
S&P 500 earnings traded at 17 times earnings on Friday. Get them back to 16 times earnings in a zero interest rate world, and new money will come pouring in.
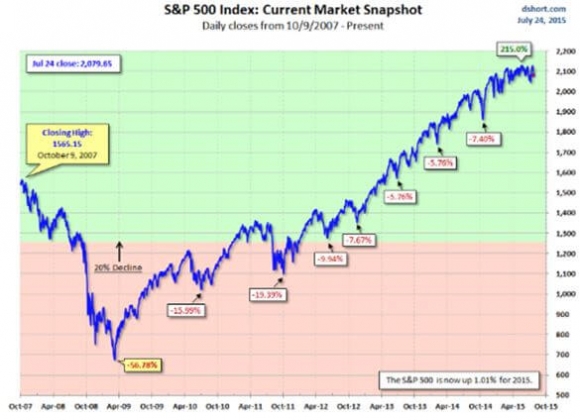
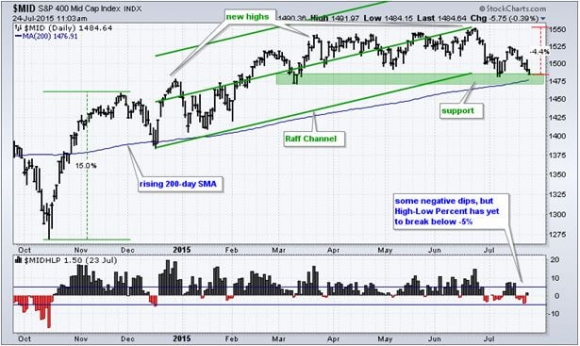
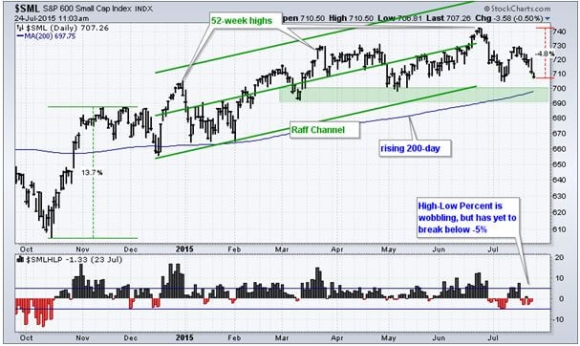
That means we may have to suffer the umpteenth 5% correction of this bull market in the weeks ahead (see chart below), or 10% in a really extreme case.
Just thought you?d like to know.

