Follow Up to Trade Alert - (SPY) July 31, 2015
As a potentially profitable opportunity presents itself, John will send you an alert with specific trade information as to what should be bought, when to buy it, and at what price. This is your chance to ?look over? John Thomas? shoulder as he gives you unparalleled insight on major world financial trends BEFORE they happen.
Trade Alert - (SPY)- UPDATE AND MARKET OVERVIEW
Buy again the S&P 500 SPDR?s (SPY) August, 2015 $214-$217 in-the-money vertical bear put spread at $2.50 or best
Opening Trade
7-29-2015
expiration date: August 21, 2015
Portfolio weighting: double up from 10% to 20%
Number of Contracts = 40 contracts
I just thought I?d give you a fresh update on the state of play in the S&P 500, given this week?s action.
I currently have a double short in the big cap index, which is hovering right around cost.
For the past three months, I have been trading the (SPY) largely from the short side, expecting multiple ongoing crises (Greece, Russia, Syria, Yemen, Iran, China, oil, and commodities) to put pressure on the index.
On the downside I have been trading against the (SPY)?s 200-day moving average, which remains in a steady six-year uptrend.
My approach has been a big success, the year-to-date return for my model trading portfolio rocketing from 22.44% when the (SPY) peaked on May 21 to 32.19%.
Buy the run downs to the 200-day, sell the rallies towards the all time highs. It has been one of the best short term trading markets I have ever seen.
Seeing a market that is stuck in a narrowing range like this is proof that we
are not in a new bear market. It is proof that we are not even in a correction, as the biggest draw down from the top has been a scant 4.2%.
We are in fact in a consolidation within a major bull market that could extend into the fall.
Having said all that, I think we are reaching the tag ends of this strategy. I believe we will eventually see a false breakdown of the 200-day and trigger panic selling by short-term, hot money players.
That will put the real bottom in a couple of points lower than the 200-daycurrently at $210.82. This is why I am long a put spread that expires in only 15 trading days.
This will then become the springboard of a rally to new all time highs that will last into the New Year.
As for timing, the Federal Reserve meeting on September 17-18 will be a natural target for such a reversal. That is when they decide on when to raise interest rates for the first time in ten years, or not.
At this stage, there is a 50/50 probability they will take action. On the one hand, employment is reaching decade highs. On the other deflation is accelerating (oil at $48?).
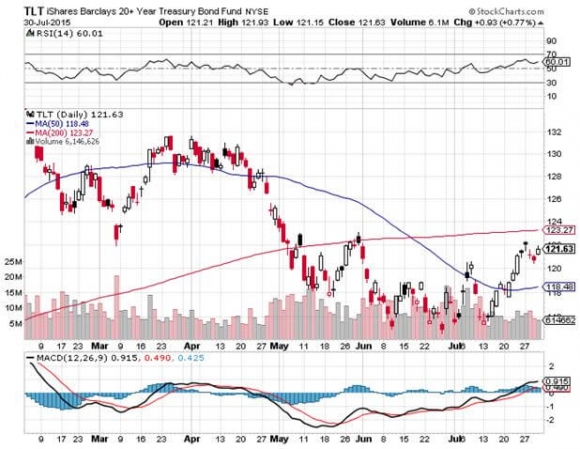
Please note that I am also short Treasury bonds going into this meeting.
All other geopolitical issues have since been resolved in favor of high equity prices world-wide. We have literally run out of things to worry about.
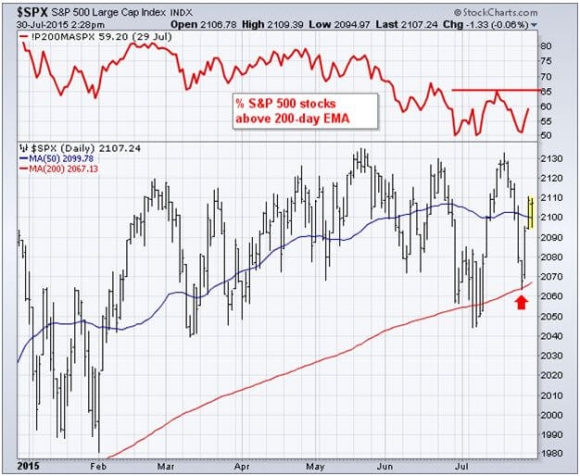
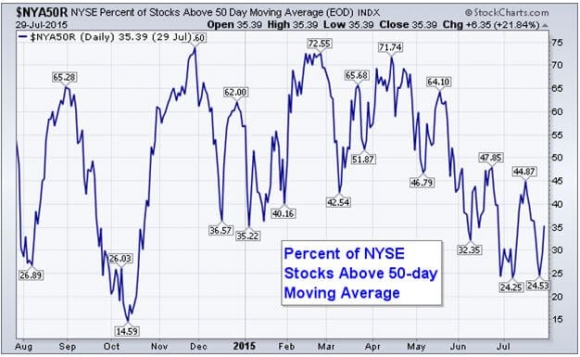
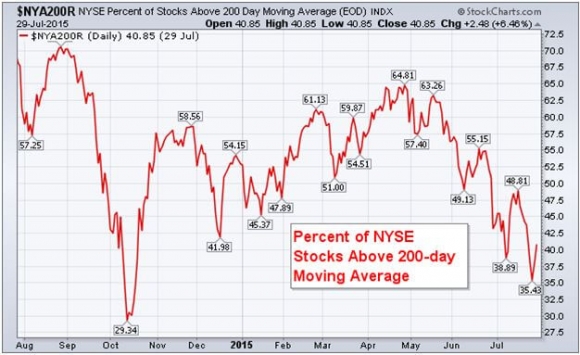
For further evidence of a coming market turnaround, please look at the charts below provided by my ever-observant friends at Stockcharts.com.
The percentage of stocks in the (SPY) above their 200-day moving average is bouncing along the 50% area, attempting to put in a bottom.
The percentage of NYSE stocks above their 50-day moving average is only 35%, and might to approaching the 15% bottom we saw last October.
The percentage of NYSE stocks above their 200-day moving average has plunged to 34.43%, and is also approaching its October bottom.
All of this data adds fuel to the arguments that a major market turnaround is coming sometime around September.
That when we will flip aggressively from the ?RISK OFF? to the ?RISK ON? side of the trade, and boost our book from the current 30% to 100% invested.
Just thought you?d like to know.
Here are the specific trades you needed to execute this position;
Buy 40 August, 2015 (SPY) $217 puts at?????$6.92
Sell short 40 August, 2015 (SPY) $214 puts at?..?$4.42
Net Cost:????????????????.....$2.50
Potential Profit: $3.00 - $2.50 = $0.50
(40 X 100 X $0.50) = $2,000 or 2.00% profit for the notional $100,000 portfolio.

