April 4, 2014 - MDT Pro Tips A.M.
While the Diary of a Mad Hedge Fund Trader focuses on investment over a one week to six-month time frame, Mad Day Trader, provided by Jim Parker, will exploit money-making opportunities over a brief ten minute to three day window. It is ideally suited for day traders, but can also be used by long-term investors to improve market timing for entry and exit points.
Current Positions
No Current Holdings
Orders are "stop on close" unless stated otherwise
.......................................................................................
Today's Working Orders
No working?orders
.......................................................................................
Stocks...
Spu's...could trade into the mid to high 1890's.
A break into the low 1860's will be met by willing buyers.
Closing under 1874 should be considered short term negative.
Nasd 100...support starts @ 3602. Closing below 3582 would have me looking for another 100 points lower.
Short term resting buy stops are 3668
3694-3700 is closing resistance.
VIX...14.40-50 is first resistance and the 200 day mvg avg.
15.50 is an exit zone for the bulk of any long volatility positions.
15.50 is the level Long Equity investors will look to pick up names on a break.
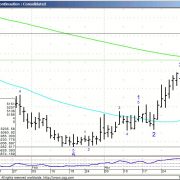
SPU/NASD..."Long S&P 500 / Short Nasd 100"..this spread is coming into the 200 day mvg avg after almost a 2 month correction.
This chart simply tells you which sector (Index) is leading.
?
Bonds...
30 Yr. ... Only price recovery and a close over 132.22 resistance is constructive. Maintaining over 132.22 after the # should lead to another point higher.
133.07 is the qtrly close.
FX...
USD/JPY...102.75 is the qtrly 50 yard line ( app 97.30 Futures)
AUD/USD...91.40 is today's 200 day mvg avg.& Fib support.
EUR/AUD...148.12 is today's 200 day mvg avg. The cross can weaken by staying under this level.
?
Commodities...
Crude (WTI)...pick a number, 100.60 is the 200 day.
The point & Figure chart shows this can fail just in front of 101.40. New closing strength over 101.70 is needed to confirm another bull run.
Gold...parameters..sustaining above 1300 and closing above 1311 or below 1265 is needed to move out of this area.
?
General Comments orValuable Insight
It's unemployment Friday. Usually I have a fairly good sense of what instruments I'd like to play.
Not so today.
It's follow the Bond Futures day. 133.07 is the qtrly close and a natural pivot. The Bonds will be a price action trade off the #.
Equity Indices are usually an after thought on unemployment Friday's.
The game will be how and where the indices hold after the release.
Attached today is a Spu/Nasd chart, (this is a Pit only U.S. Session) with the green line being the 200 day mvg avg.
This is where the rubber meets the road. Direction will either reject or follow through at this level.
It's a go or no go level.
The trade has been Long Dow & S&P 500 names / Selling ( profit taking) NASDAQ 100 names since February.
The weekly chart shows that the corrective phases can take a couple of months +-.
Meaning; the Nasd has the chance to regain leadership for a rally in the Equity Indices with a risk on board after the data release
Opening Range Time Frame Trading again today.
?
Short Term View...
Keep trading to make money. The opportunity will be in individual names.
Individual stocks look to be an easier read based off their own technical's.?
We are Neutral Equities.
For Medium Term Outlook click here.
For Glossary of terms and abbreviations click here.


