August 10, 2011 - The Worst Case Scenario
Featured Trades: (THE WORST CASE SCENARIO)
3) The Worst Case Scenario. 'There is oversold, and there is OVERSOLD'. That was a comment made by my friend, technical analyst Arthur Hill, in the wake of the Dow's breathtaking 634 point crash. Some indicators were showing the most oversold levels in 12 years.
I think that there is a better than 50/50 chance that we put the low for the year in the stock market yesterday. We may go down one more time to put in a double bottom. We might even trigger stops and make a new marginal low. But the bulk of the selling is done, and distress liquidation sales by margin clerks will no longer be a factor in the market. The strength of the economy just doesn't justify it.
The stock market has just discounted a recession that isn't going to happen. Slow growth, yes, but not a recession. One often hears in the strategy community that stocks have discounted 20 out of the last ten recessions, and the August swoon is a classic example of that.
The move on Monday reminds me of the 508 point, 22.6% selling climax we saw during the October, 1987 crash, which I remember as if it were yesterday. That event saw a Monday downdraft followed by a Tuesday melt up. This is when the economy was percolating along at a 7% GDP growth rate. The whole incident was blamed on 'portfolio insurance', which thankfully is long gone. Sound familiar?
That was back when I was a slave on a trading desk at Morgan Stanley. When I tried to buy shares for my account that day, the clerk burst into tears and threw the handset on the floor. I didn't get the shares.
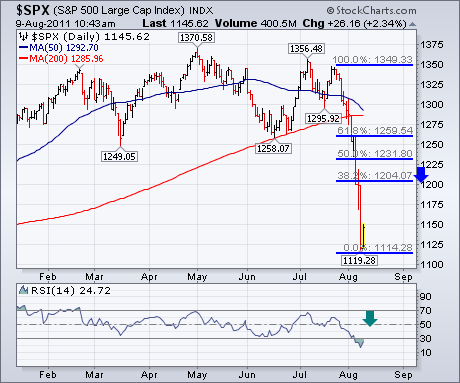
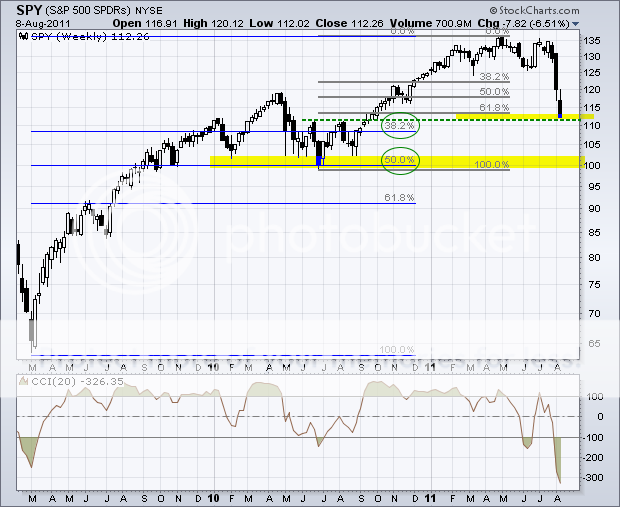
Now that the machines have turned friendly, let's take a look at the upside Fibonacci resistance levels. Those kick in at 1,204, 1231, 1259, and 1,349, with decreasing levels of probability. If I am totally wrong, perish the thought, and the free fall continues, then I have provided Fibonacci support levels in the (SPY) that take us all the way down to $92. If you are wondering who the hell Fibonacci is, I will address that on a later day.

-
-


