August 22, 2013 - MDT Pro Tips A.M.
While the Diary of a Mad Hedge Fund Trader focuses on investment over a one week to six-month time frame, Mad Day Trader, provided by Jim Parker, will exploit money-making opportunities over a brief ten minute to three day window. It is ideally suited for day traders, but can also be used by long-term investors to improve market timing for entry and exit points.
Current Positions?
No current positions or working orders
.................................................................................................................
Stocks..
Spu's...1629-30 is short swing Fib support. Closing under this level will lead to a new dynamic, which we'll address if we see price action under this level.
Sustaining and closing over 1644 would confirm a temporary low, something we've been unable to do all week. The Low 50's will still be a problem area
Bonds...
30 yr.... Bounces should occur from 129.05
FX...
USD/JPY... 98.35 (app 101.70 Futures) is short term Yen support.?99.15 (100.85 Futures) is? macro support and the upside break out in the dollar.
EUR/JPY...this remains firm above 130.25
EUR/AUD...we thought this would give us a look at 150 again, however a close today below 147.87 would put in an ORL day leaving us with the impression that we've seen the high in this cross for a long time.
GBP/JPY...there are resting buy stops over 154.07-22.
Commodities...
Oil...104.95 is resistance and the upside pivot. 102.20-30 is a bounce zone with resting sell stops below 101.80. Big swing support does not come in until just shy of 100.
Brent...as long as this maintains above 108.20 it remains on firm footing.
Gold...price action below 1350 will trigger liquidation.
Silver...22.50 has to hold an initial break to avoid a bigger correction to as low as 21.82.
?
General Comments or Valuable Insight
Equities and Bonds are directionally challenged, meaning they are oversold and the patient trader will be rewarded.
Selling weakness into support levels will not be pleasurable.
Trade from the correct side of the market at the mapped out levels.
The past two days are good examples of being able to pick the macro spots...Match them up with the Vix and trade from either side and make money.
Vix has been an extremely accurate indicator for recent market turns. Yesterday was a good example of matching up another instrument to telegraph short term moves and directional traps for the general board.
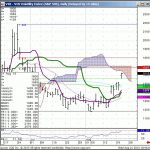
The 1655 resistance level caught the first low in the Spu's, which was followed by a retest of the 200 day @ 14.70 matching up with the 50 day @ 1655 Spu's (the days high).
The high and low of the Vix caught the high and low of the day in the Equity Indices.
Short Term View...
Trade instruments off their own technical s
Time Frame Trading.
Trade what you see.
After yesterday's big vomit the Equities and Bonds are still in sell the big rally mode.
The Equity Indices and Bond Futures are trading oversold. This simply means you have to sell rallies not breaks. Technical levels will find willing buyers the first time into the # sets.
The technical Models are down in both. The Spu's keep tying to turn up only to fail in the latter few minutes of the day. This is typical price action for a down market.
Bull markets spend all day trying to break and rally late. Bears are the polar opposite, they rally all day only to fail late day.
Today has the potential to put in a short term bottom. Time will tell.
For Glossary of terms and abbreviations click here.

