August 8, 2014 - MDT Pro Tips A.M.
While the Diary of a Mad Hedge Fund Trader focuses on investment over a one week to six-month time frame, Mad Day Trader, provided by Jim Parker, will exploit money-making opportunities over a brief ten minute to three day window. It is ideally suited for day traders, but can also be used by long-term investors to improve market timing for entry and exit points.
Current Positions
No Positions
.......................................................................................
Today's Working Orders
SELL?USAU?(30 yr. Bond Futures)?@ 140.14
BUY 2?SPU (EPU4) @ 1864
BUY 2 SPU (EPU4) @ 1864
.......................................................................................
Stocks...
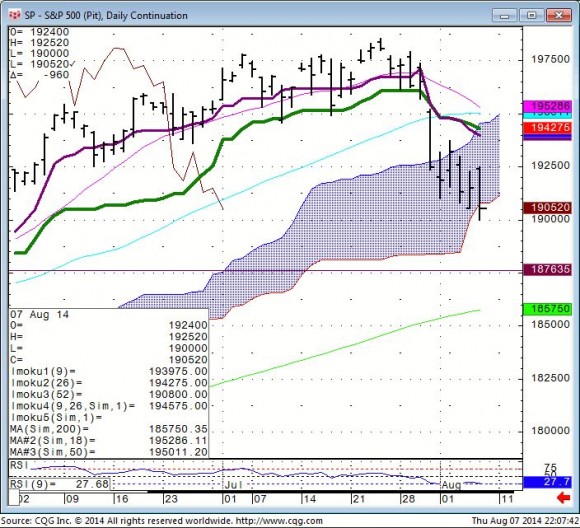
Spu's...(Pit Session) put in an ORL day. 1874-57 is the low risk buy zone.
SSO...104.25 is the 200 DMA.
Nasd 100...3800-10 is support. A close over 3859 is needed for bottoming action.
VIX...14.80 is first support. Only a couple of closes above 17.75 would lead to higher prices and a much bigger sell off in the Equity indices.
EWP...37.00 is weekly support.
ASX 200...53724 is the 200 DMA support level. A close below 5290 is needed for a bigger corection
?
Bonds...
30 yr. Bonds...140.14-17 is resistance and the level we've been targeting for months. This is the 50% Fib for the past 2 years.
?
FX...
AUD/JPY.... 93.90 is the 200 DMA support. 93.30 would be an extreme.
EUR/AUD...price action above 144.17 keeps this on a positive footing with a 145.30 being the next resistance.
?
Commodities...
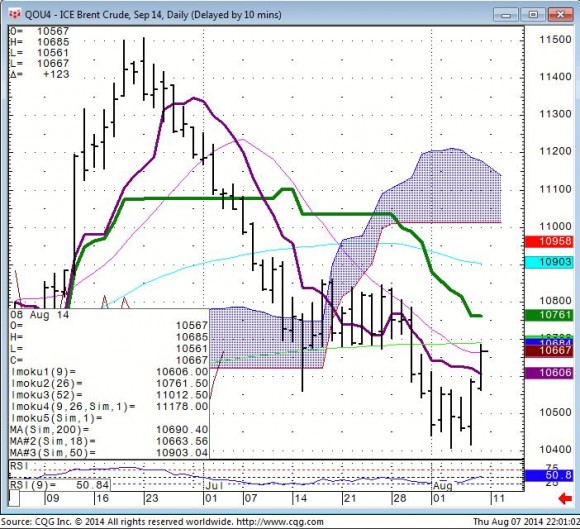
Brent...put in an ORH day. 106.70 is 200 DMA resistance.
Crude.. (WTI) 99.00-99.20 is the first rejection zone. Then the upside is in almost 80 cent increments. 99.83 is the 200 DMA. 100.55 is first Fib resistance for this swing.
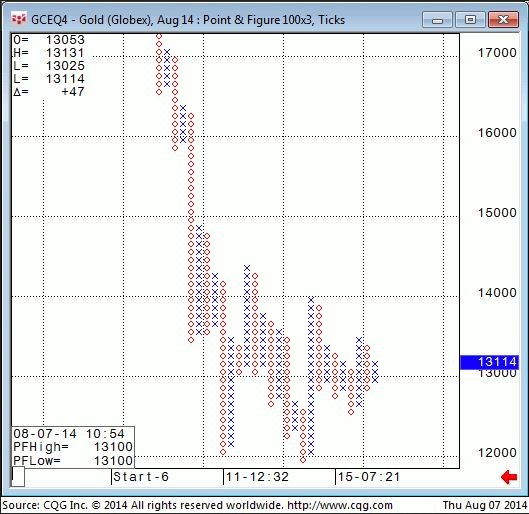
Gold...needs closes over 1313-14 to gain upside momentum.
The long term Point & Figure chart shows price action above 1324 ish
will be a break out to the upside that should not be faded.
General Comments orValuable Insight
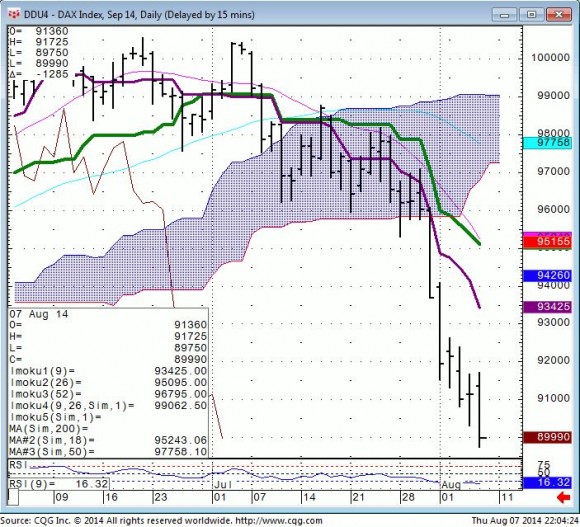
Spu's & Dax both put in ORL days with the 30 Yr. Bond Futures putting in an ORH.
Spu's & Dax are both getting oversold on the daily charts.
Bonds are approaching the tgt and major retrace level.
We saw the expected follow through in all three patterns, however the condition of the Equity Indices are such that these patterns can have a nasty habit of having a lower exhaustion and reversing with low RSI's.
The key here is to be vigilant, patient and not early.
We've placed some resting orders for today at levels that should be manageable from a risk/reward perspective.
Time Frame Trading today. What happens after London close is just as important as what occurs early.
The Metals and Oil have gone bid with a flight to hard assets.
Pay attention to your technical levels!!!!
Full Moon trading is in effect!!!!!!!
Sunday night is the Full Moon.
Many instruments are aligning. I'm looking to buy the Equity Indices before I sell them at the aforementioned levels.
A recovery higher on the day (above yesterday's closes) in the major U.S. Equity Indices will precipitate some big time bottom fishing
S&P 500 (PIT) Daily Continuation
Index
Brent Oil?
Gold?
For Medium Term Outlook click here.
?For Glossary of terms and abbreviations click here.

