August 9, 2024

(DON’T GET TOO COMFY – MORE CHOP & CHURN IS ON THE HORIZON)
August 9, 2024
Hello everyone.
ARE WE THERE YET?
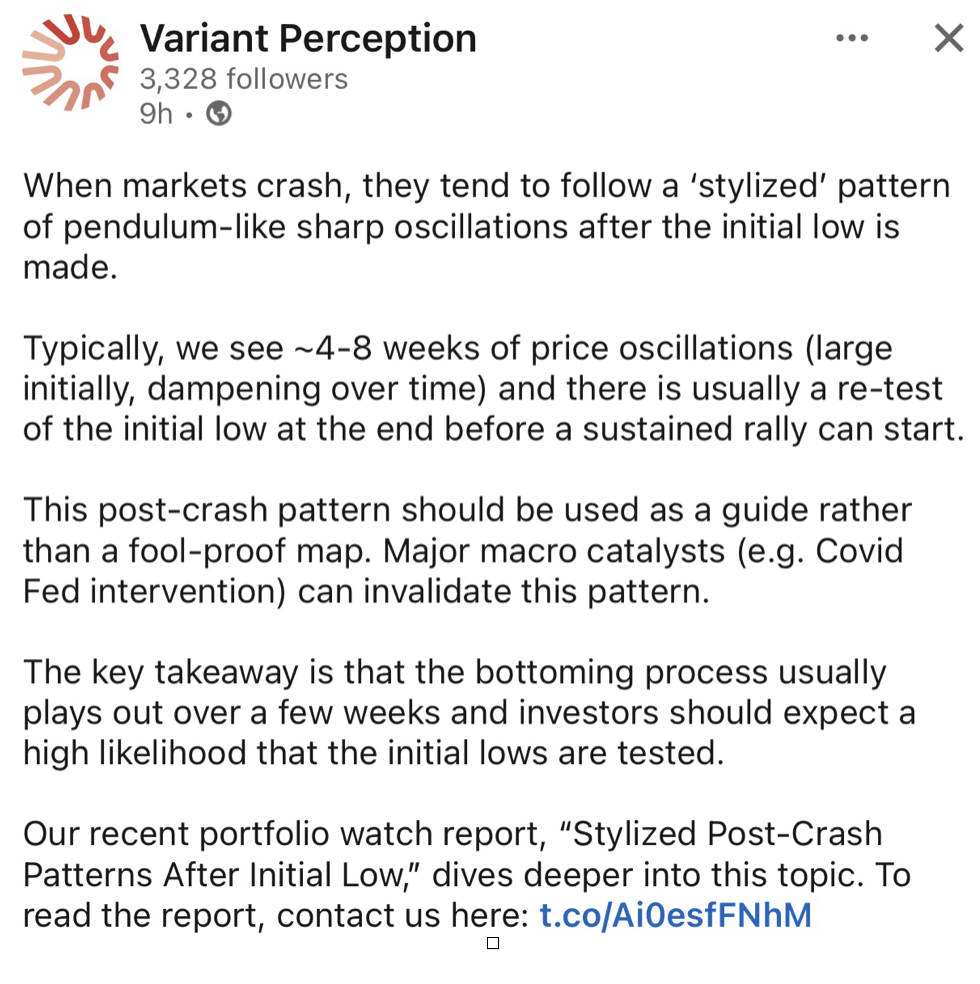
Historically, it is rare for markets to put in correction lows in August. September and October are more likely to see an eventual bottom. So, be ready for equity market volatility in September.
ELI LILLY(LLY)
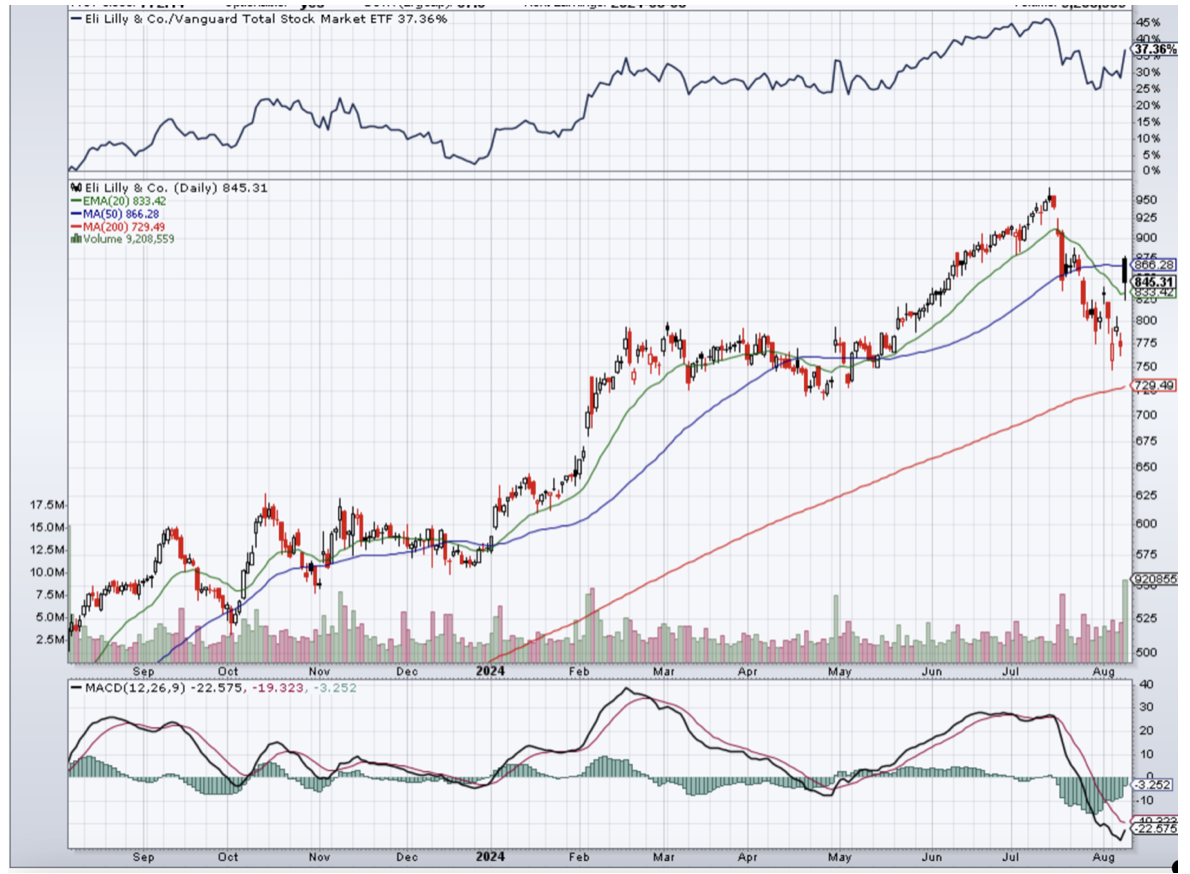
Eli Lilly reported impressive second quarter earnings. Mounjaro, a prescription medication for Type 2 diabetes, and Zepbound, a prescription medicine for weight loss are two drugs by Eli Lilly seeing incredible demand. In its first full quarter in the U.S. market, Zepbound brought in $517.4 million in revenue. In the second quarter, it generated $1.24 billion in U.S. revenue.
Obesity affects nearly 42% of adults in the U.S. according to the latest data from the Centres for Disease Control and Prevention.
The demand for weight loss drugs in on the rise around the world. The global market for obesity medication is expected to hit $105 billion in 2030, according to Morgan Stanley’s research. That’s up from the firm’s forecast in September of $77 billion.
Drug manufacturers like Eli Lilly and Novo Nordisk, the pharmaceutical company that makes Ozempic and Wegovy, are racing to meet that demand. Both companies are investing billions to build new manufacturing plants to boost supply of the popular medications.
Eli Lilly was founded in 1876 and became a publicly traded company on the New York Stock Exchange in 1952.
$1000 invested in Eli Lilly 10 years ago would now be worth $13,143, an estimated percentage increase of 1,214%.
The lesson here is don’t try and attempt to use a company’s short-term performance to predict how well or how poorly it may do in the future. There will always be market fluctuations. The key is to stay the course and let the growth narrative unfold over time.
This is an item of interest, not a suggestion to buy (LLY) right now. But (LLY) is an excellent stock to hold for the long term.
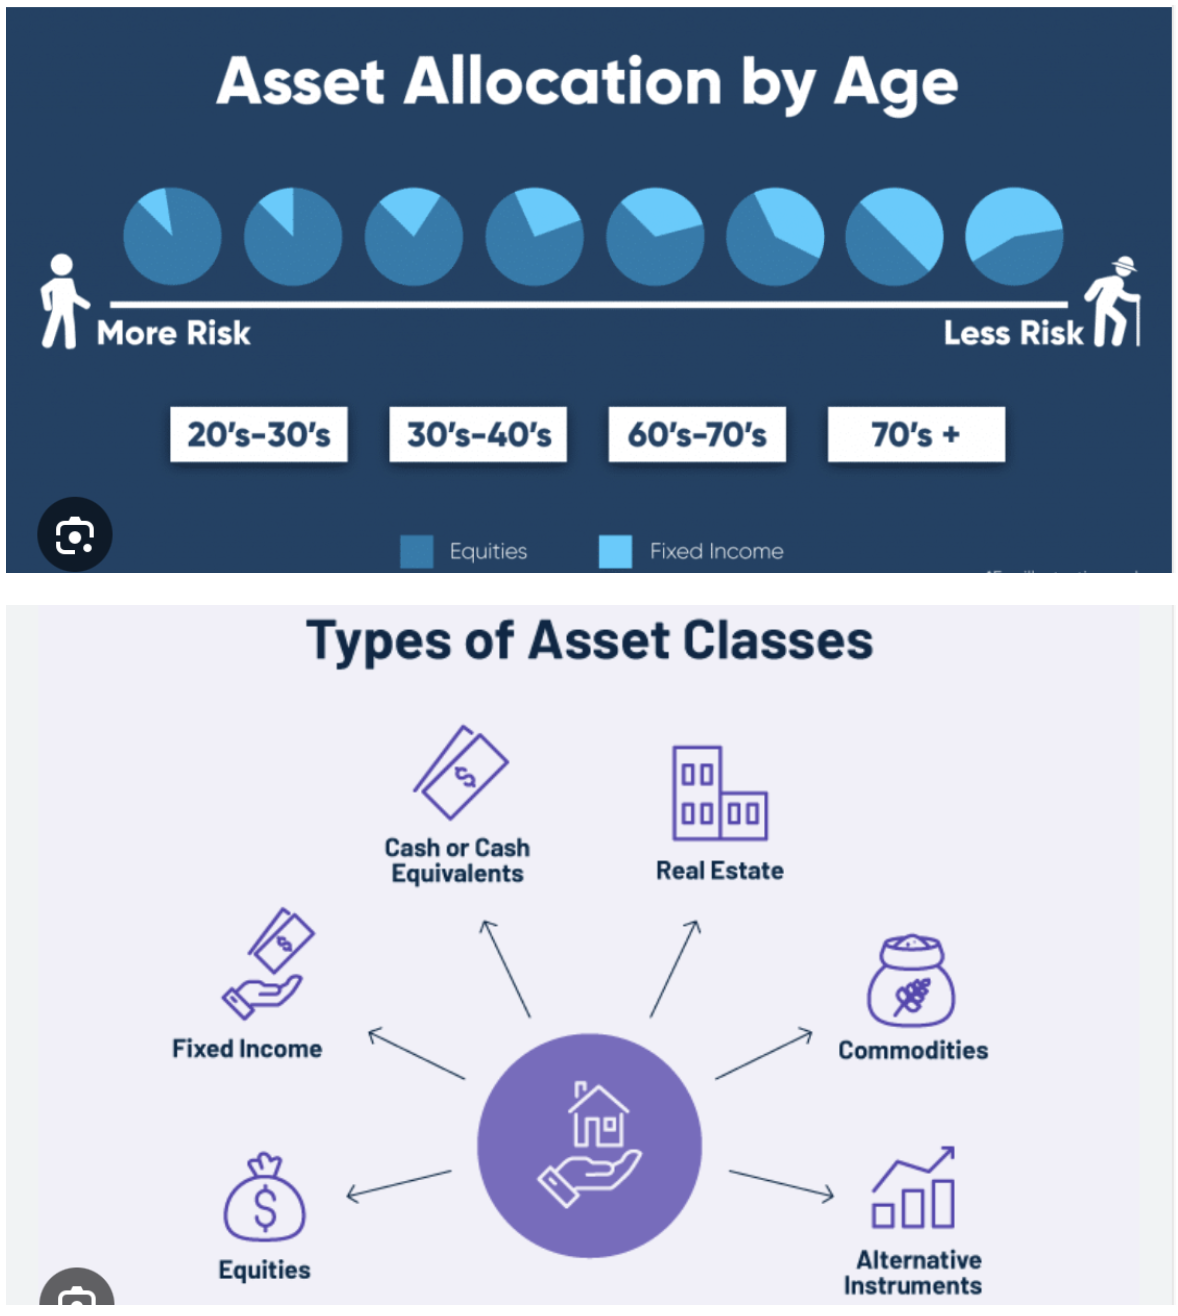
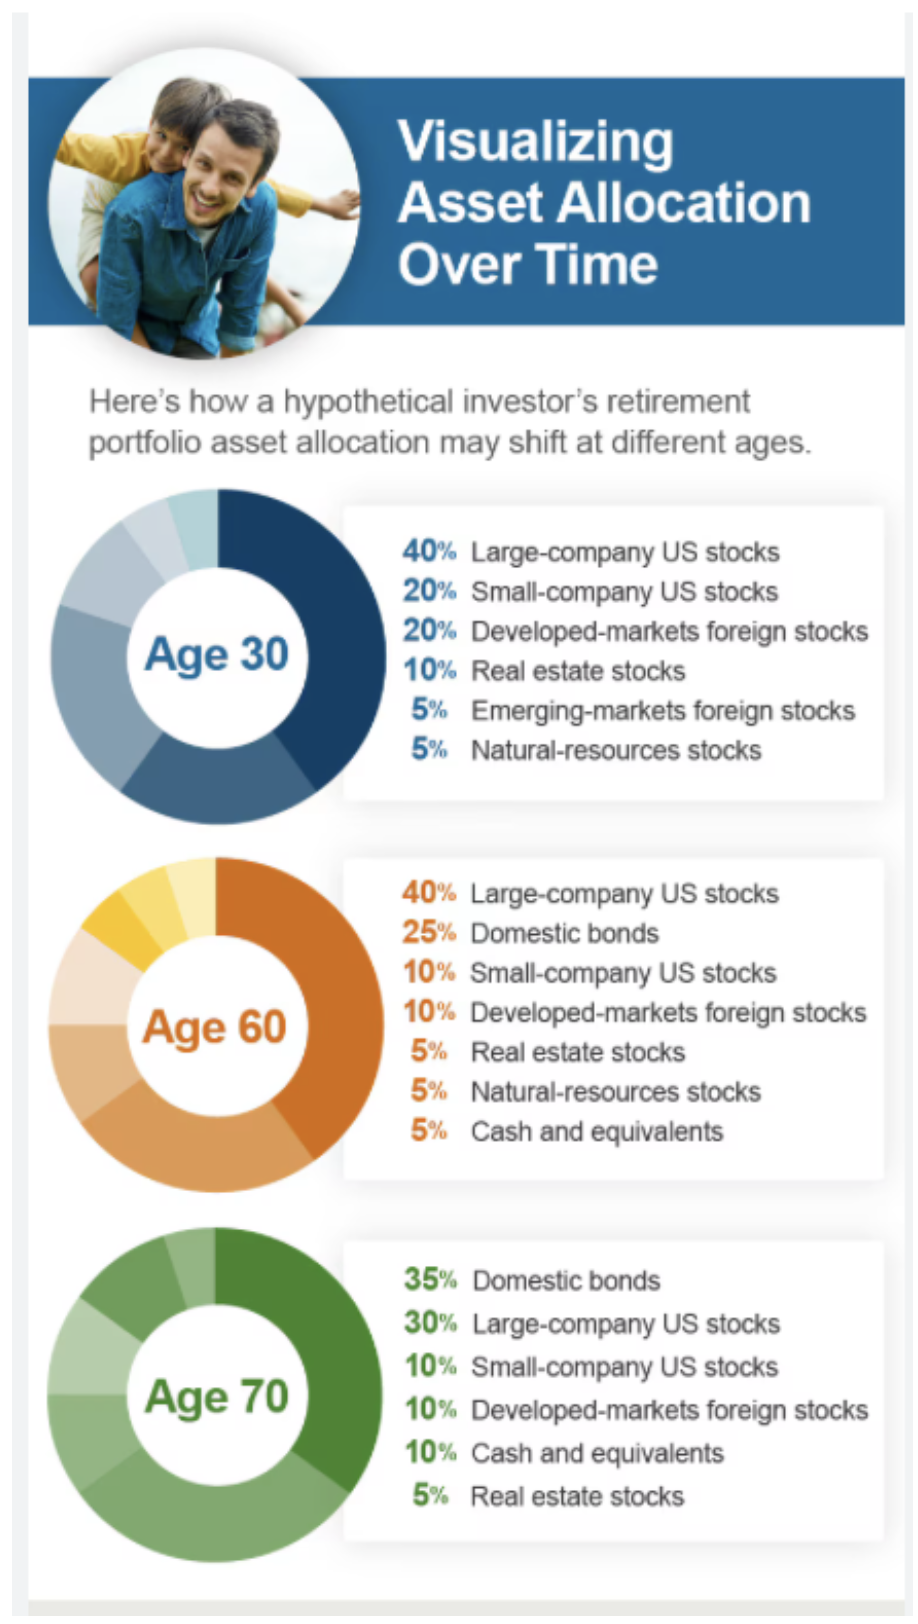
WHAT SHOULD MY PORTFOLIO LOOK LIKE?
An illustration of asset classes and allocations by age.
It is different for everyone.
So, one example does not fit all.
WHAT IS… FORWARD PRICE/ EARNINGS RATIO?
The forward price/earnings ratio is a measurement of value. It is found by dividing a stock’s most recent price by next year’s earnings per share estimate for the entire year. If that estimate is unavailable, then the estimate for the full current fiscal year is used.
For a better understanding of what forward price-to-earnings means, let’s look at an example. Let’s say a company’s current stock price is $25. Analysts estimate an EPS of $1.50 for the next quarter. Its forward P/E ratio would be 25/1.5=16.
Difference between forward P/E and trailing P/E
The main difference between standard P/E and the forward price-to-earnings definition is that the former uses actual EPS that has already been reported by a company, whereas the latter uses the EPS estimate.
The standard P/E is used to evaluate whether a company is overvalued or undervalued, whereas forward P/E ratio determines future estimated value.
Let’s look at an example. If the current price of a stock is $8 with the EPS of $1, and its earnings are expected to double in the next year to $2, the forward P/E ratio will be 4x, or half of the company’s value when it earned $1.
If the forward P/E is lower than the current P/E, analysts expect earnings to increase. On the other hand, when the forward P/E is higher than the current P/E ratio, analysts expect earnings to decrease.
QI CORNER
SOMETHING TO THINK ABOUT…
Cheers
Jacquie

