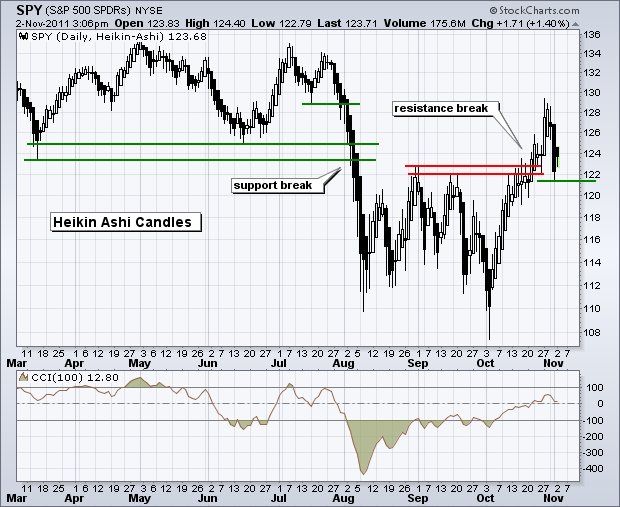
Featured Trades: (THE BATTLE OF THE 100 DAY MOVING AVERAGE)
2) The Battle of the 100 Day Moving Average. Take a look at the chart below from StockCharts.com and it is clear that the line in the sand for the stock market is the 100 day moving average at 1,312.
I have noticed an interesting pattern that trading has fallen into since stocks peaked on April 29. All year, the Monday action indicated the medium term direction of the market. For the first four months, that brought rising stocks more than 90% of the time. For the past month, Mondays of delivered falling stocks like clockwork.
The indexes then bring in a few days of indecisive, double digit, low volume rallies. Next, a big risk off trade hits on Friday as short term traders clear the books for the weekend. The weekend press then produces some new bomb shells from Europe plus a lot of handwringing from domestic analysts that severely beat up stocks on Monday morning. That is then the low for the week.
If the 100 day moving average breaks then look out below, because the 'RISK OFF' trade will then continue all the way up until QE2 ends on June 30. The next support becomes the 200 day average at 1,240, or down 75 points from here. If it doesn't break, then it won't. Just thought you'd like to know.
https://madhedgefundtrader.com/wp-content/uploads/2019/05/cropped-mad-hedge-logo-transparent-192x192_f9578834168ba24df3eb53916a12c882.png00Mad Hedge Fund Traderhttps://madhedgefundtrader.com/wp-content/uploads/2019/05/cropped-mad-hedge-logo-transparent-192x192_f9578834168ba24df3eb53916a12c882.pngMad Hedge Fund Trader2011-05-27 01:50:162011-05-27 01:50:16May 27, 2011 - The Battle of the 100 Day Moving Average
Featured Trades: (THE VULTURES ARE CIRCLING AROUND THE EURO), (FXE), (EUO)
2) The Vultures are Circling Around the Euro. It has not been a great week for the beleaguered European currency (FXE), (EUO). The chickens, no, make that vultures, are coming home to roost.
Belgian and Spanish debt has been downgraded. The UK's debt is under review. The ratings agencies now seem to be taking aim at Italy. Perhaps the only good news for the Euro is that former IMF chief and future French presidential candidate, Dominique Strauss-Kahn, was able to post bail for his sex crimes in New York.
To understand why Italy is such a big deal, take a look at the chart below showing bank holdings of PIIGS debts. Italian bonds are far and away the most widely owned, dwarfing all other sovereign issuers combined, and their default would certainly wipe out a major portion of European bank capital. If you wonder why I am constantly asserting that European banks have a de facto negative net worth and their eventual demise with bring the death of the euro, this is a good reason.
In the meantime, hedge funds are starting to jump on the bandwagon for the Euro short play. Some two thirds of the long positions in the futures markets have been liquidated in the past ten days. We will see the next down leg for the Euro when the reminder gets dumped and the street flips to a net short. As for me, I have been short since $1.49 and am comfortable with the position. Any rally from here, and I will be quite happy to double up.
https://madhedgefundtrader.com/wp-content/uploads/2019/05/cropped-mad-hedge-logo-transparent-192x192_f9578834168ba24df3eb53916a12c882.png00Mad Hedge Fund Traderhttps://madhedgefundtrader.com/wp-content/uploads/2019/05/cropped-mad-hedge-logo-transparent-192x192_f9578834168ba24df3eb53916a12c882.pngMad Hedge Fund Trader2011-05-25 01:50:102011-05-25 01:50:10May 25, 2011 - The Vultures are Circling Around the Euro
Featured Trades: (HOW'S THAT RISK OFF TRADE WORKING?),
(SPX), (SDS), (GLD), (USO), (DUG), (TLT), (TBT), (FCX), (CU)
3) How's That 'RISK OFF' Trade Working? Take a look at the chart below since I made my watershed call to put on a 'RISK OFF' portfolio on April 25 (click here for the link). Almost all ass asset classes peaked exactly four days later.
You may recall that the 'RISK OFF' portfolio bets on falling prices for stocks (SPX), (SDS), commodities (CU), (FCX), oil (USO), (DUG), foreign currencies (UUP), (FXE), (EUO), and precious metals (GLD), (SLV). Simultaneously, a flight to safety bid would bring rising prices for the dollar and bonds. The fundamental rational for the portfolio was that all of the money that ran into assets to take advantage of QE2 would run right back out again. Call this my 'Anti-QE2 Portfolio'
I think that the 'RISK OFF' trade will run for not days or weeks, but months. The challenge will be not to get shaken out of the portfolio when the inevitable, technically driven short covering rallies ensue. What would it take to change my mind and return to a 'RISK ON' portfolio? Here is a short list:
*US corporations produce blow out earnings in their September quarterly reports three months off.
*China abandons its inflation fight, cuts interest rates and bank reserve requirements.
*We get a run of weak economic data that prompts Ben Bernanke to launch a real QE3.
*The Japanese governments awakens from its tsunami induced stupor and orders the Bank of Japan to run the printing presses to finance reconstruction. That enables the yen to return as a carry trade and collapse.
All of the above will eventually occur. For precise timing, watch this space. You'll be the first to know.
1) Macro Millionaire Portfolio Clocks a 40% Gain YTD. After posting one of the best days of the year yesterday, up 5%, the Macro Millionaire model trading portfolio year to date performance topped 40%. This compares to a gain of only 11% for the S&P 500 since November 29, when our tracking year began. The gains were made thanks to our aggressive short positions in US stocks, oil, and the Euro taken not long after the markets peaked on April 29.
Macro Millionaire is now the fastest growing online trading and mentoring service. It has helped thousands of individuals to learn the strategies, tools, and thinking employed by the top hedge fund traders. If you would like more information on how to subscribe to this highly entertaining and informative educational program, please email John Thomas at madhedgefundtrader@yahoo.com.
https://madhedgefundtrader.com/wp-content/uploads/2019/05/cropped-mad-hedge-logo-transparent-192x192_f9578834168ba24df3eb53916a12c882.png00Mad Hedge Fund Traderhttps://madhedgefundtrader.com/wp-content/uploads/2019/05/cropped-mad-hedge-logo-transparent-192x192_f9578834168ba24df3eb53916a12c882.pngMad Hedge Fund Trader2011-05-24 02:00:462011-05-24 02:00:46May 24, 2011 - Macro Millionaire Portfolio Clocks a 40% Gain YTD
2) QE3 Has Already Started. Most analysts have missed the fact that QE3 has already started in earnest. Of course, it would have been easy to miss. Ben Bernanke has not made any grand pronouncements. He hasn't done some public thinking out loud, as he did among friends at Jackson Hole, Wyoming last August. It is not even called 'QE3'. Think of it as a 'stealth QE3'. But make no mistake. A new variety of quantitative easing has already begun in a big way, and is generating its desired effect.
The new QE3 is the 'RISK OFF' trade. QE2 ended up pouring $600 billion into stocks, commodities, oil, gold, and silver. Since April 29, the prospect of slowing economic growth has prompted this hot money to take flight and bail from these assets classes. Think of it as the same $600 billion stampeding into risky markets, doing a 180, and then stampeding right back out against.
Where is all this money going? Into the Treasury bond market. We have in fact been in new bull market for bonds since February, taking the yield on the ten year Treasury down from 4.10% to 3.10%. If the current 'RISK OFF' trade continues, or even accelerates, we could see ten year yields down to 2.0%-2.5% by the end of the summer.
In the ultimate irony, we might even see bonds peak and risk assets bottom on June 30, the day QE2 ends. Given the way that events compress and accelerate these days, I would not be surprised to see things unfold this way. This is why I have been selling short puts on the long bond ETF (TLT), and avoiding bearish bets on bonds, like the plague, such as the (TBT). It is also why I have been piling on shorts in oil and stock at every opportunity.
There is no doubt that this is Ben Bernanke and Treasury Secretary Tim Geithner's plan, and they have voiced as much to Washington confidents in recent weeks. The beauty of this plan is that it has no government fingerprints on it. They are getting private investors to do the heavy lifting for them. That will make them immune from attacks from anti-interventionists, like the Tea Party, and anti-Federal Reservists, like Ron Paul. Bernanke can just sit back and let natural market forces do his handiwork for him.
Clever Ben, clever.
Of course Bernanke cannot employ this strategy forever. Eventually the expiration of Obama's many stimulus programs, the end of the Bush tax cuts, a growing drag by the state and municipal sector, and a worsening structural unemployment problem, will slow economic growth enough to where the Fed will have to take real action. Then they will have to launch a real QE3, or face another Great Recession, something the administration would rather not see in an election year.
Keep in mind that the next Recession will be far worse than the last one. None of the problems of the 2008-2009 debacle, like too big to fail, the real estate collapse, and the burgeoning bad debts on bank balance sheets, have really been solved. The can has merely been kicked forward. The only difference will be that there will be no TARP and no bail outs next time. The chips will fall where they want.
This all means that you better keep running your shorts and make some serious coin from the unfolding 'RISK OFF' trade while you can. Look out below.
https://madhedgefundtrader.com/wp-content/uploads/2019/05/cropped-mad-hedge-logo-transparent-192x192_f9578834168ba24df3eb53916a12c882.png00Mad Hedge Fund Traderhttps://madhedgefundtrader.com/wp-content/uploads/2019/05/cropped-mad-hedge-logo-transparent-192x192_f9578834168ba24df3eb53916a12c882.pngMad Hedge Fund Trader2011-05-24 01:50:222011-05-24 01:50:22May 24, 2011 - QE3 Has Already Started
2) The S&P 500 in 2020. Dr. Robert Shiller certainly knows which end of a PE multiple to hold up. He is one of the few economists out there who has produced the sort of long term historical and mathematical analysis of financial valuations that is rare on Wall Street.
Among his many claims to fame was his forecast of the coming residential real estate collapse in the mid 2,000's, banging every pot and pan as loudly as he could to warn us all. His Case-Shiller index is the benchmark for tracking prices in regional real estate markets.
So I have to pay attention when the eminent Yale professor predicts that the S&P 500 will go no higher that 1430 by 2020, a mere 90 points higher than it is today. His data shows that from 1871 to 2008, the multiple has averaged 14, ranging from a high of 45 in 2000 to a low of 5 in 1921. By his calculation, the current multiple normalized over the past ten years is 23, making the market outrageously expensive.
That implies that we are only 17 months into a second lost decade for the stock market. With the country still digesting the housing bust, American standards of living falling, its currency chronically weak, relative global competitiveness shrinking, deficits ballooning, wealth excessively concentrating at the top, and the stimulus pump running dry, what else did you expect?
https://madhedgefundtrader.com/wp-content/uploads/2019/05/cropped-mad-hedge-logo-transparent-192x192_f9578834168ba24df3eb53916a12c882.png00Mad Hedge Fund Traderhttps://madhedgefundtrader.com/wp-content/uploads/2019/05/cropped-mad-hedge-logo-transparent-192x192_f9578834168ba24df3eb53916a12c882.pngMad Hedge Fund Trader2011-05-23 01:50:062011-05-23 01:50:06May 23, 2011 - The S&P 500 in 2020
Featured Trades: (THE BEAR CASE FOR OIL), (USO), (DUG)
3) The Bear Case for Oil. Let's do some out of the box thinking here. Let's say that the global economy is really slowing down. The demand for oil will fall. Let's say that China continues to raise interest rates, slowing its economy further. Then Chinese oil demand starts to wane.
Then we bring on stream new US onshore supplies opened up by advanced technologies in places like the Bakken field in North Dakota. Then current high prices at the pump deliver a summer driving season that is a shadow of its former self. Next, the exchanges get religion and decide to damp down speculation in earnest by raising margin requirements on oil.
Now, let's thrown in an outlier. Muammar Khadafi chokes to death on a bad falafel, bringing the Libyan civil war to an immediate end, and unleashing 1.2 million barrels a day of light crude on the European market.
What I have just outlined here is a perfect storm for oil prices. It's not that these are low probability events. They are in fact the most likely scenario that will unfold over the next three months. And they are all likely to hit at the same time, taking crude down to the bottom of the last year's range of $84/barrel.
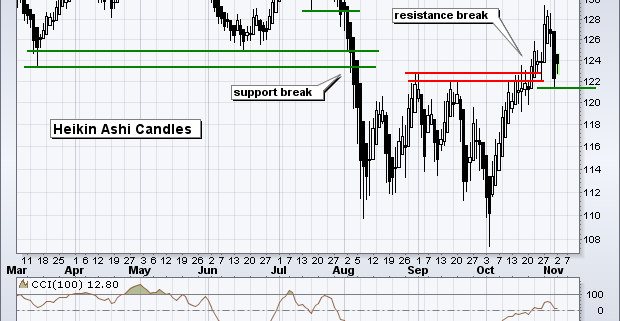
So I think that it is prudent here to start adding some short exposure for oil. Selling short the US Oil Fund (USO) might be a good idea, which has one of the worst tracking errors in the ETF world, and never fails to rob investors blind. Play this from the short side, and these gross inefficiencies work in your favor. When I employed this strategy through the put options in March, I scored a near double in just five days.
Just to add a little kicker to your short oil play, you might buy the (DUG), a -2X inverse short ETF on the oil majors now trading at $29.25. Falling oil prices will lead to plunging oil company profitability, shrinking PE multiples, and sharply declining stock prices, all of which work in favor of (DUG). Throw in a broader global risk off trade, and this thing works with a turbocharger.
https://madhedgefundtrader.com/wp-content/uploads/2019/05/cropped-mad-hedge-logo-transparent-192x192_f9578834168ba24df3eb53916a12c882.png00Mad Hedge Fund Traderhttps://madhedgefundtrader.com/wp-content/uploads/2019/05/cropped-mad-hedge-logo-transparent-192x192_f9578834168ba24df3eb53916a12c882.pngMad Hedge Fund Trader2011-05-23 01:40:522011-05-23 01:40:52May 23, 2011 - The Bear Case for Oil
Featured Trades: (THE GLENCORE EFFECT), (BLK), (RENN), (LNKD)
3) The Glencore Effect. One of the greatest indicators that the music has stopped playing, the fat lady is singing, and it is time to get out of Dodge City, is the level of insider selling. Given the recent hyperactivity of the IPO calendar, it's looking like it is a great time to take off on a long summer vacation.
The commodities trading giant, Glencore, has lead the parade this year with a massive $11 billion IPO in Europe. The booty will be split up among a mere five individuals, making them all billionaires. Chinese networking giant, Ren Ren (RENN), hit the market for $743 million a month ago, and promptly tanked 30%.
Only today, Linkedin raised $352 million in an issue that doubled in 20 minutes. Institutional investors complained that allocations were made with an eyedropper. Facebook and Twitter are said to be waiting in the wings with gigantic offerings of their own.
Of course, the official explanation for the timing of these issues includes the diversification of the investor base, raising cash to broaden their business, and improving the company's public profile. Wall Street often speaks in an arcane, difficult to understand language, so let me translate this for you lay people: 'Get out at the top!'
Everyone remembers too well Larry Fink's infamous Blackrock IPO brought out at the top of the market in 2007, just before the stock market crash took 75% off its value. I was also once a beneficiary of such strategic timing. Morgan Stanley (MS) went public not long before the 1987 crash sent its share price sprawling.
One of the basic facts of life on Wall Street is that the seller of a security usually knows a lot more about it than you do. If nothing else, these sales are sucking money out of the market that would otherwise being going into equities already listed. Such is the power of the printing press. The prudent would take notice of these huge cash calls and respond by reducing the risk in their portfolios, laying on some downside protection, raising cash, and get ready for the approaching storm clouds. Lake Tahoe, the Hamptons, and Key West are beckoning.
https://madhedgefundtrader.com/wp-content/uploads/2019/05/cropped-mad-hedge-logo-transparent-192x192_f9578834168ba24df3eb53916a12c882.png00Mad Hedge Fund Traderhttps://madhedgefundtrader.com/wp-content/uploads/2019/05/cropped-mad-hedge-logo-transparent-192x192_f9578834168ba24df3eb53916a12c882.pngMad Hedge Fund Trader2011-05-20 01:50:262011-05-20 01:50:26May 20, 2011 - The Glencore Effect
'We live in a nominal world right now. Inflation is going up modestly, so the dollars we are making are nominal dollars, not real dollars,' said legendary value investor, Leon Cooperman, of Omega Advisors.
https://madhedgefundtrader.com/wp-content/uploads/2019/05/cropped-mad-hedge-logo-transparent-192x192_f9578834168ba24df3eb53916a12c882.png00Mad Hedge Fund Traderhttps://madhedgefundtrader.com/wp-content/uploads/2019/05/cropped-mad-hedge-logo-transparent-192x192_f9578834168ba24df3eb53916a12c882.pngMad Hedge Fund Trader2011-05-20 01:00:542011-05-20 01:00:54May 20, 2011 - Quote of the Day
Featured Trades: (ELIOT WAVE'S GRIM MESSAGE), (SPX)
3) Eliot Wave's Grim Message. Regular readers are well aware that I rely on John Murphy and Arthur Hill at StockCharts .com for top drawer technical analysis of the financial markets. Lately they have been knocking the ball out of the park, pumping out indicators that global markets were topping and that risk was high, almost on a daily basis.
So I wanted to highlight a chart they prepared that applies a traditional Eliot Wave analysis to the S&P 500. Eliot Wave theory was first created by Ralph Nelson Elliot in the 1930's, and the modern day iteration is propagated by disciple, Robert Prector. In the simplest terms, Eliot Wave theory calls for bull markets with five up waves to be followed by bear markets with three down waves.
That makes the chart below particularly alarming. It shows that the bull market that began in August reached its wave 5 top on April 29 and is now has three down waves ahead of it. That means that the era of buying dips is behind us, and that the prudent thing to do from here is to sell every rally.
If you need more reasons to stay awake at night, then take a look at the next chart of stocks trading above their 50 day and 200 day moving averages. Those have both started to show a sharp decline, presaging a broader fall in the market.
Over the years I have noticed that the people who slavishly follow Eliot Wave, or any other technical program, get slaughtered. None of this takes into consideration the end of QE2, the expiring debt ceiling, or out plummeting economic growth. However, it can be a very useful tool when combined with the dozens of other that I use.
StockCharts.com provides one of the best value for money research products out there. They offer an impressive range of tools to all comer for free. A one year subscription to their 'ExtraRT' service products costs only $369 per year. This includes an interactive section where readers are permitted to post their own technical analysis. Some of them have attracted quite massive followings in their own right. You can visit their site at www.StockCharts.com .
https://madhedgefundtrader.com/wp-content/uploads/2019/05/cropped-mad-hedge-logo-transparent-192x192_f9578834168ba24df3eb53916a12c882.png00Mad Hedge Fund Traderhttps://madhedgefundtrader.com/wp-content/uploads/2019/05/cropped-mad-hedge-logo-transparent-192x192_f9578834168ba24df3eb53916a12c882.pngMad Hedge Fund Trader2011-05-19 01:40:292011-05-19 01:40:29May 19, 2011 - Elliott Wave's Grim Message
Legal Disclaimer
There is a very high degree of risk involved in trading. Past results are not indicative of future returns. MadHedgeFundTrader.com and all individuals affiliated with this site assume no responsibilities for your trading and investment results. The indicators, strategies, columns, articles and all other features are for educational purposes only and should not be construed as investment advice. Information for futures trading observations are obtained from sources believed to be reliable, but we do not warrant its completeness or accuracy, or warrant any results from the use of the information. Your use of the trading observations is entirely at your own risk and it is your sole responsibility to evaluate the accuracy, completeness and usefulness of the information. You must assess the risk of any trade with your broker and make your own independent decisions regarding any securities mentioned herein. Affiliates of MadHedgeFundTrader.com may have a position or effect transactions in the securities described herein (or options thereon) and/or otherwise employ trading strategies that may be consistent or inconsistent with the provided strategies.
We may request cookies to be set on your device. We use cookies to let us know when you visit our websites, how you interact with us, to enrich your user experience, and to customize your relationship with our website.
Click on the different category headings to find out more. You can also change some of your preferences. Note that blocking some types of cookies may impact your experience on our websites and the services we are able to offer.
Essential Website Cookies
These cookies are strictly necessary to provide you with services available through our website and to use some of its features.
Because these cookies are strictly necessary to deliver the website, refuseing them will have impact how our site functions. You always can block or delete cookies by changing your browser settings and force blocking all cookies on this website. But this will always prompt you to accept/refuse cookies when revisiting our site.
We fully respect if you want to refuse cookies but to avoid asking you again and again kindly allow us to store a cookie for that. You are free to opt out any time or opt in for other cookies to get a better experience. If you refuse cookies we will remove all set cookies in our domain.
We provide you with a list of stored cookies on your computer in our domain so you can check what we stored. Due to security reasons we are not able to show or modify cookies from other domains. You can check these in your browser security settings.
Google Analytics Cookies
These cookies collect information that is used either in aggregate form to help us understand how our website is being used or how effective our marketing campaigns are, or to help us customize our website and application for you in order to enhance your experience.
If you do not want that we track your visist to our site you can disable tracking in your browser here:
Other external services
We also use different external services like Google Webfonts, Google Maps, and external Video providers. Since these providers may collect personal data like your IP address we allow you to block them here. Please be aware that this might heavily reduce the functionality and appearance of our site. Changes will take effect once you reload the page.