Featured Trades: (CHARTS ARE BREAKING DOWN ALL OVER)
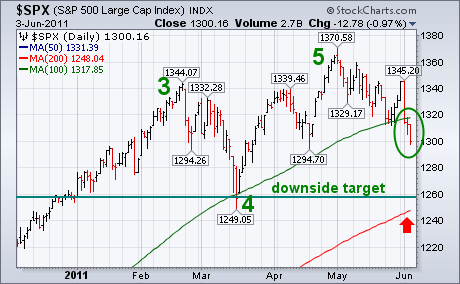
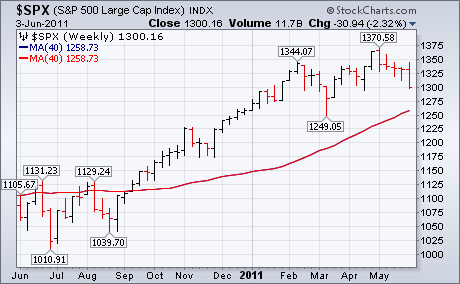
2) Charts Are Breaking Down All Over. My friends at StockCharts.com produced a wonderful series of charts today showing how destructive was the damage in risk assets, in general, and equities, in particular. The chip shot on the downside for the S&P 500 is now 1,260. With near panic among short term traders becoming endemic, we could hit that number very quickly. Furthermore, the long term trend line that has been supporting the bull market for 26 months is now at risk.
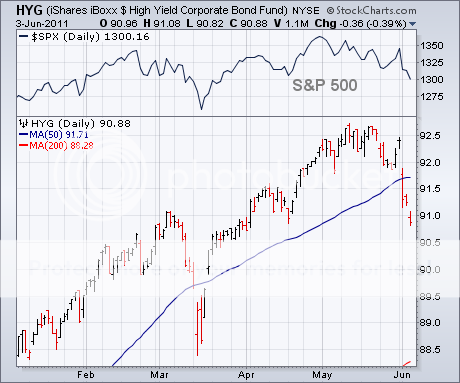
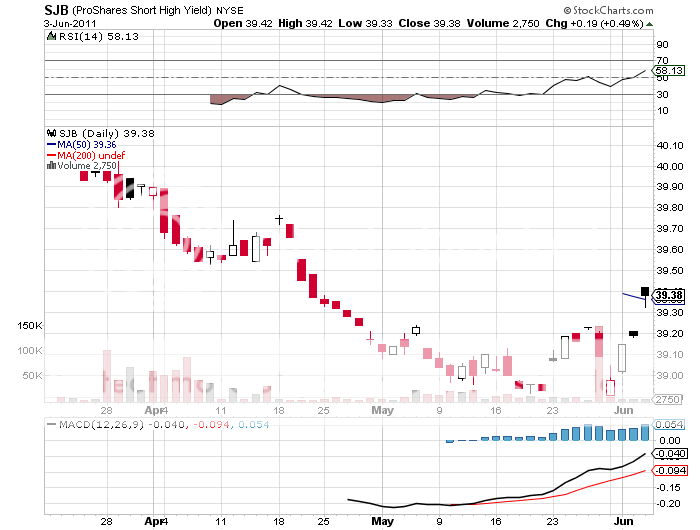
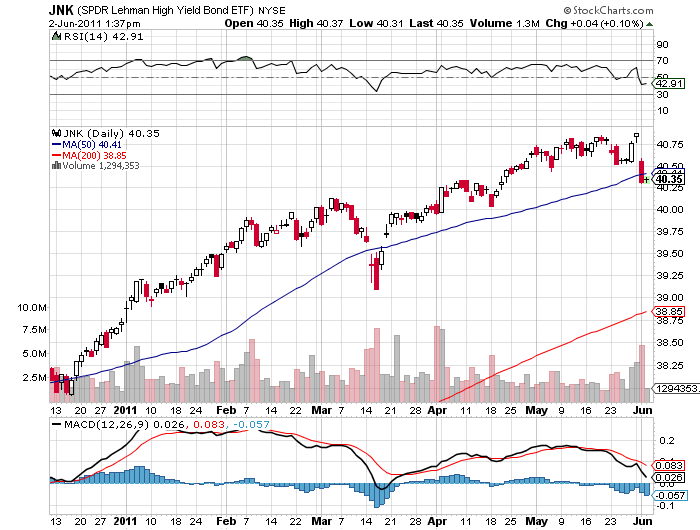
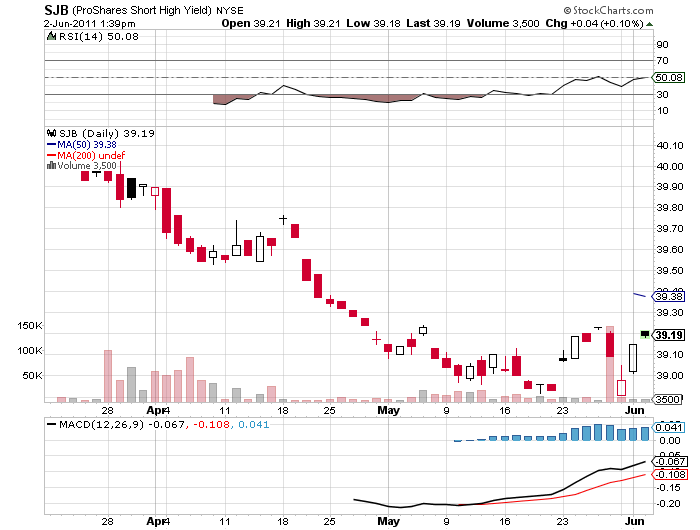
Also, take a look at the chart for the junk bond ETF (HYG), which is breaking down in a major way. You may recall that I argued that this asset class was also wildly over valued and due for a major round of selling (click here for 'Take a Ride in the New Short Junk ETF'). Those who followed my advice to buy the short junk bond ETF (SJB) have profited nicely, while the rest of the world has been going to hell in a hand basket.
Keep in mind that these are only charts, and that their utility has been somewhat diminished by the high frequency traders that now dominate the marts. But they do seem to be lining up nicely with my watershed piece that I published on April 22, 'Meet the 'RISK OFF' Portfolio' (click here for the piece)
-
-
-
-
The Breakdowns Are Everywhere
https://madhedgefundtrader.com/wp-content/uploads/2019/05/cropped-mad-hedge-logo-transparent-192x192_f9578834168ba24df3eb53916a12c882.png00Mad Hedge Fund Traderhttps://madhedgefundtrader.com/wp-content/uploads/2019/05/cropped-mad-hedge-logo-transparent-192x192_f9578834168ba24df3eb53916a12c882.pngMad Hedge Fund Trader2011-06-06 01:50:192011-06-06 01:50:19June 6, 2011 - Charts Are Breaking Down All Over
Featured Trades: (THE ECONOMIC HEADWINDS ARE COMING)
3) The Economic Headwinds Are Coming. Whenever someone is dead right about the long term outlook for the economy, I like to revisit their comments. So am once again running a conversation I had with my friend, David Hale, a month ago, back when investors were stumbling over each other to pile on risk assets, and the indexes were hitting new highs for the year daily.
I have followed David Hale's prognostications about the global economy for two decades, and have always found his views insightful, if not useful. Although based in Chicago (click here for his site), he is almost permanently on the road, consulting with foreign governments, major banks, and big hedge funds.
He called me recently while driving a rental car to some godforsaken Midwestern airport, holding a GPS in one hand, a cell phone in the other, and steering the wheel with his knees, to give me his current take. It is not a pretty picture.
The end of QE2 and Obama's many stimulus programs are about to create a major drag on the US economy. On top of this you have to consider the likelihood that the Bush tax cuts will not be renewed a second time. You can also take out the deflationary impact of high oil prices. Add it all up, and you come up with a negative 5% headwind in annualized GDP hitting at the beginning of 2012. Although the sedentary, Harris tweed jacket wearing David is not prone to making extremist, sensationalist comments, only one ugly word can come out of this: recession.
The bad news is that the markets don't know this yet. But they will. Using the traditional rule of thumb that equity markets lead the economy by about six months, that means you should start unloading your positions right about now.
The Economy is Facing Major Head Winds
https://madhedgefundtrader.com/wp-content/uploads/2019/05/cropped-mad-hedge-logo-transparent-192x192_f9578834168ba24df3eb53916a12c882.png00Mad Hedge Fund Traderhttps://madhedgefundtrader.com/wp-content/uploads/2019/05/cropped-mad-hedge-logo-transparent-192x192_f9578834168ba24df3eb53916a12c882.pngMad Hedge Fund Trader2011-06-06 01:40:262011-06-06 01:40:26June 6, 2011 - The Economic Headwinds Are Coming
4) Here Comes the Rhodium ETF. Deutsche Bank has launched the first ever ETF for the precious metal Rhodium, to be listed on the London stock exchange. Expecting a massive inflow of capital into this obscure corner of the hard asset world, traders ran prices up 20% last week. ETF launches for platinum (PPLT), and Palladium last year had a similar effect on prices.
Rhodium is one of the world's hardest metals, and is used by the auto industry as a substitute catalyst for platinum and palladium. Like the other white metals, it therefore has twin demand for both industrial and investment purposes. About $2 billion a year worth of rhodium is mined, compared to $10 billion for platinum and $30 billion for silver. At $2,350 an ounce, rhodium is the most valuable of the precious metals, compared to gold (GLD) ($1542), platinum (PPLT) ($1,812), palladium (PALL) ($769), and silver (SLV) ($36). During the hard asset squeeze in 2008, rhodium reached an incredible $10,000 an ounce.
I'll be writing more about rhodium in the near future. When hard assets come back into vogue, this is something you want to keep on your radar. It has all the ingredients for a potential sharp appreciation; a tiny global supply and potentially insatiable demand.
-
-
https://madhedgefundtrader.com/wp-content/uploads/2019/05/cropped-mad-hedge-logo-transparent-192x192_f9578834168ba24df3eb53916a12c882.png00Mad Hedge Fund Traderhttps://madhedgefundtrader.com/wp-content/uploads/2019/05/cropped-mad-hedge-logo-transparent-192x192_f9578834168ba24df3eb53916a12c882.pngMad Hedge Fund Trader2011-06-06 01:30:132011-06-06 01:30:13June 6, 2011 - Here Comes the Rhodium ETF
Featured Trades: (HERE COMES THE DOUBLE DIP), (TLT), (TBT), (JNK), (SJB)
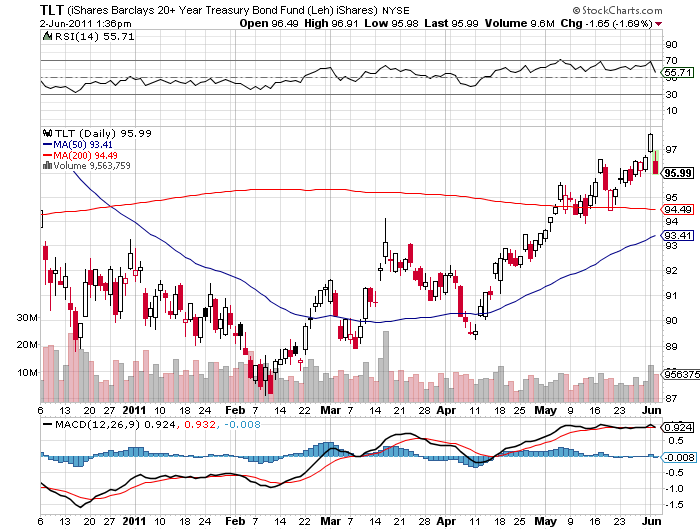
1) Here Comes the Double Dip. With yields on ten year Treasury bonds piercing below the 3.00% level through to 2.95%, you now have to take seriously the possibility of a double dip recession. This is particularly concerning given that bond markets are usually right, and equity markets are usually wrong, when forecasting the future direction of the economy. That makes stocks look especially expensive right here.
Look at the chart below to see that the ETF long dated bonds (TLT) has rallied a full ten points since I made my bullish call on fixed income in March. This was not an easy call to make, as the consensus then was for a coming collapse of Treasury bond prices in the run up to the end of QE2.
It was such a bold call that others talked me into keeping the position small, always a big mistake. As hedge fund legend George Soros taught me, 'Anything worth doing is worth doing big.' The chart for the (TLT) is now starting to resemble that for silver a month ago. You would be mad to initiate new longs here.
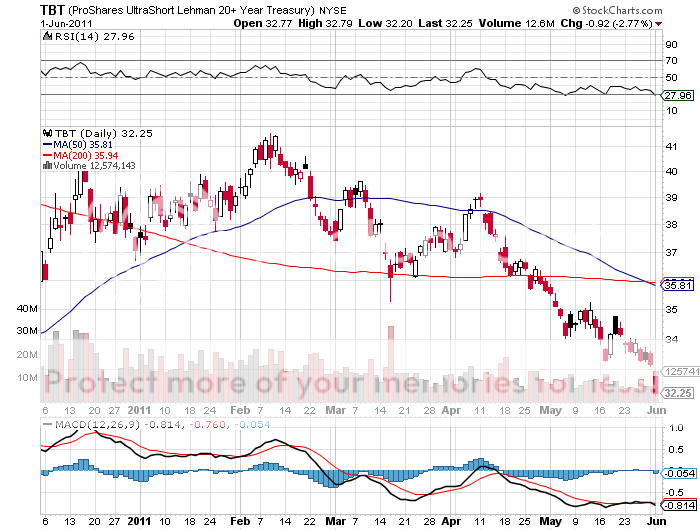
Which brings me to the chart for the inverse long dated Treasury short ETF (TBT). No security has been taken out to the woodshed and spanked more severely, falling 24% since its February peak. I made a killing in the (TBT) in December, nimbly stepped out in January, and never went back. The (TBT) has a double burden here, since as a -2X leveraged fund you are short twice the coupon on the underlying bonds. That takes the cost of carry to a hefty 7% a year, more than 50 basis points a month, down from the 9% we saw at the beginning of the year. When it gets to 6%, last year's low, call me.
There is one corner of the fixed income universe that continues to pique my interest. If stocks fall, junk bonds will not be far behind, as these issuers are least able to cope with the blunt force of another slowdown in the economy. They are historically very expensive, with spreads over Treasuries at all-time lows. That makes the newly issued short junk ETF (SJB) especially interesting.
-
-
-
-
Is the Double Dip Coming?
https://madhedgefundtrader.com/wp-content/uploads/2019/05/cropped-mad-hedge-logo-transparent-192x192_f9578834168ba24df3eb53916a12c882.png00Mad Hedge Fund Traderhttps://madhedgefundtrader.com/wp-content/uploads/2019/05/cropped-mad-hedge-logo-transparent-192x192_f9578834168ba24df3eb53916a12c882.pngMad Hedge Fund Trader2011-06-03 02:00:452011-06-03 02:00:45June 3, 2011 - Here Comes the Double Dip
2) My Big Miss of the Year. If you had to name one asset that has benefited from every macro trend under the sun this year, it has to be the Swiss franc. No matter what happened, be it the coming Greek default, the European banking crisis, the Japanese tsunami, the Libyan Civil War, the commodity collapse, and now the slowing US economy, all seemed to trigger kneejerk buying of even more bushels of Swiss francs.
Switzerland is certainly a country with many attractions. The economy is healthy, with the most recent retail sales up 7.5% and unemployment at an enviable 4.2%. It is home to several world class companies, like, Nestle, Roche, Novartis, and Swatch. It has perennially run a strong current account surplus. Its 347 banks control assets amounting to seven times the country's GDP, and account for 40% of stock market capitalization (compared to 9% in the US). Despite shunning membership in the European Community, it has developed a world class export industry in heavy and precision machinery, pharmaceuticals, and high quality textiles. It is not all about watches, cheese, and Swiss army knives.
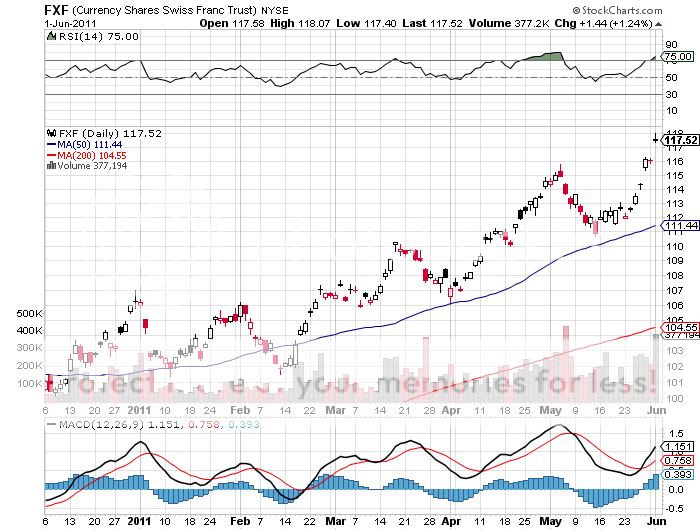
None of this explains why the Swiss franc has been so strong. Since the beginning of the year, the currency has soared by 17% to 85 centimes to the dollar. Note that the ETF (FXF) is priced in the inverse to the cash market, meaning that it takes $1.17 to buy one Swiss franc. To give you some long term perspective on this, the dollar is now 72% cheaper than when I first visited this alpine paradise 43 years ago, when is cost SF3.00 to purchase a greenback.
As strong as the fundamentals are for Switzerland, they have nothing to do with the strength of the currency. It has become the flight to safety currency of choice for Europeans. This is not a new development. While a director of Swiss Bank Corporation, I personally saw gold bars imprinted with the German eagle secreted there by high ranking Nazi's and never reclaimed. This is one theory why the Germans didn't invade Switzerland during WWII.
Later, asset protecting investors believed that the Swiss Army's formidable mountain redoubts could hold the Soviet army at bay. To this day, there are still formidable stockpiles of weapons in the basements of the big Swiss banks, and many of the senior staff double as army officers.
One reason the Swiss franc has been a speculative target is that the country has a Lilliputian GDP of $642 billion, only 4.4% of America's. The tide of money into the franc has been so large that the Swiss can do little to stop it. The Swiss National Bank has lost billions of dollars buying euros and selling francs to slow the ascent, losing billion in the process, on paper anyway.
I missed this whole move this year because I focused on the country's fundamentals, which are quaint but irrelevant in the global scheme of things, and not the capital flows. It is clear that the latter is overwhelming the former. And concluding that capital flows are now the driver, you can cobble together an argument that the move is coming to an end. We have seen the early stirrings of what could be a global, 'RISK OFF' move into the dollar. Once it gets up a decent head of steam, it would not be a stretch to see this spill into the Swiss currency as well.
I'm not saying you should sell short the Swiss franc here, but the bull move is certainly getting long in the tooth, and could suddenly die of a heart attack. As for my miss, I shall be punished severely when I visit Switzerland in a few weeks for a round of mountain climbing and have to pay through the nose for my fondue, russet potatoes, raclette, and schnapps.
-
-
-
Switzerland is Looking a Little Toppy to Me
https://madhedgefundtrader.com/wp-content/uploads/2019/05/cropped-mad-hedge-logo-transparent-192x192_f9578834168ba24df3eb53916a12c882.png00Mad Hedge Fund Traderhttps://madhedgefundtrader.com/wp-content/uploads/2019/05/cropped-mad-hedge-logo-transparent-192x192_f9578834168ba24df3eb53916a12c882.pngMad Hedge Fund Trader2011-06-03 01:50:162011-06-03 01:50:16June 3, 2011 - My Big Miss of the Year
Featured Trades: (RISK OFF RETURNS WITH A VENGEANCE)
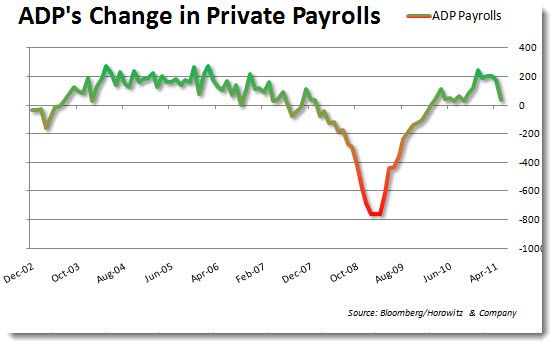
2) 'RISK OFF' Returns With a Vengeance. I have not seen a day this ugly in quite a long time. From the second that a dismal ADP report came out in the pre-market, it was a steady slide, right up until the close. The S&P 500 couldn't rally even five points on the day, and closed down a stomach churning 30.66 points.
I knew that risk markets had to be peaking yesterday when several hedge fund managers called me to review my logic behind my current short positions, right after the S&P Case Shiller U.S. National Home Price Index showed that residential real estate had returned to free fall mode.
The Challenger-Grey ADP report, an indicator of employment trends, could not have been worse. Consensus expectations hovered around 190,000, but came in at only 38,000. Then the May ISM index plunged from 60.4 to 53.5, the lowest point in nearly three years. Moody's threw fat on the fire with several sovereign debt downgrades.
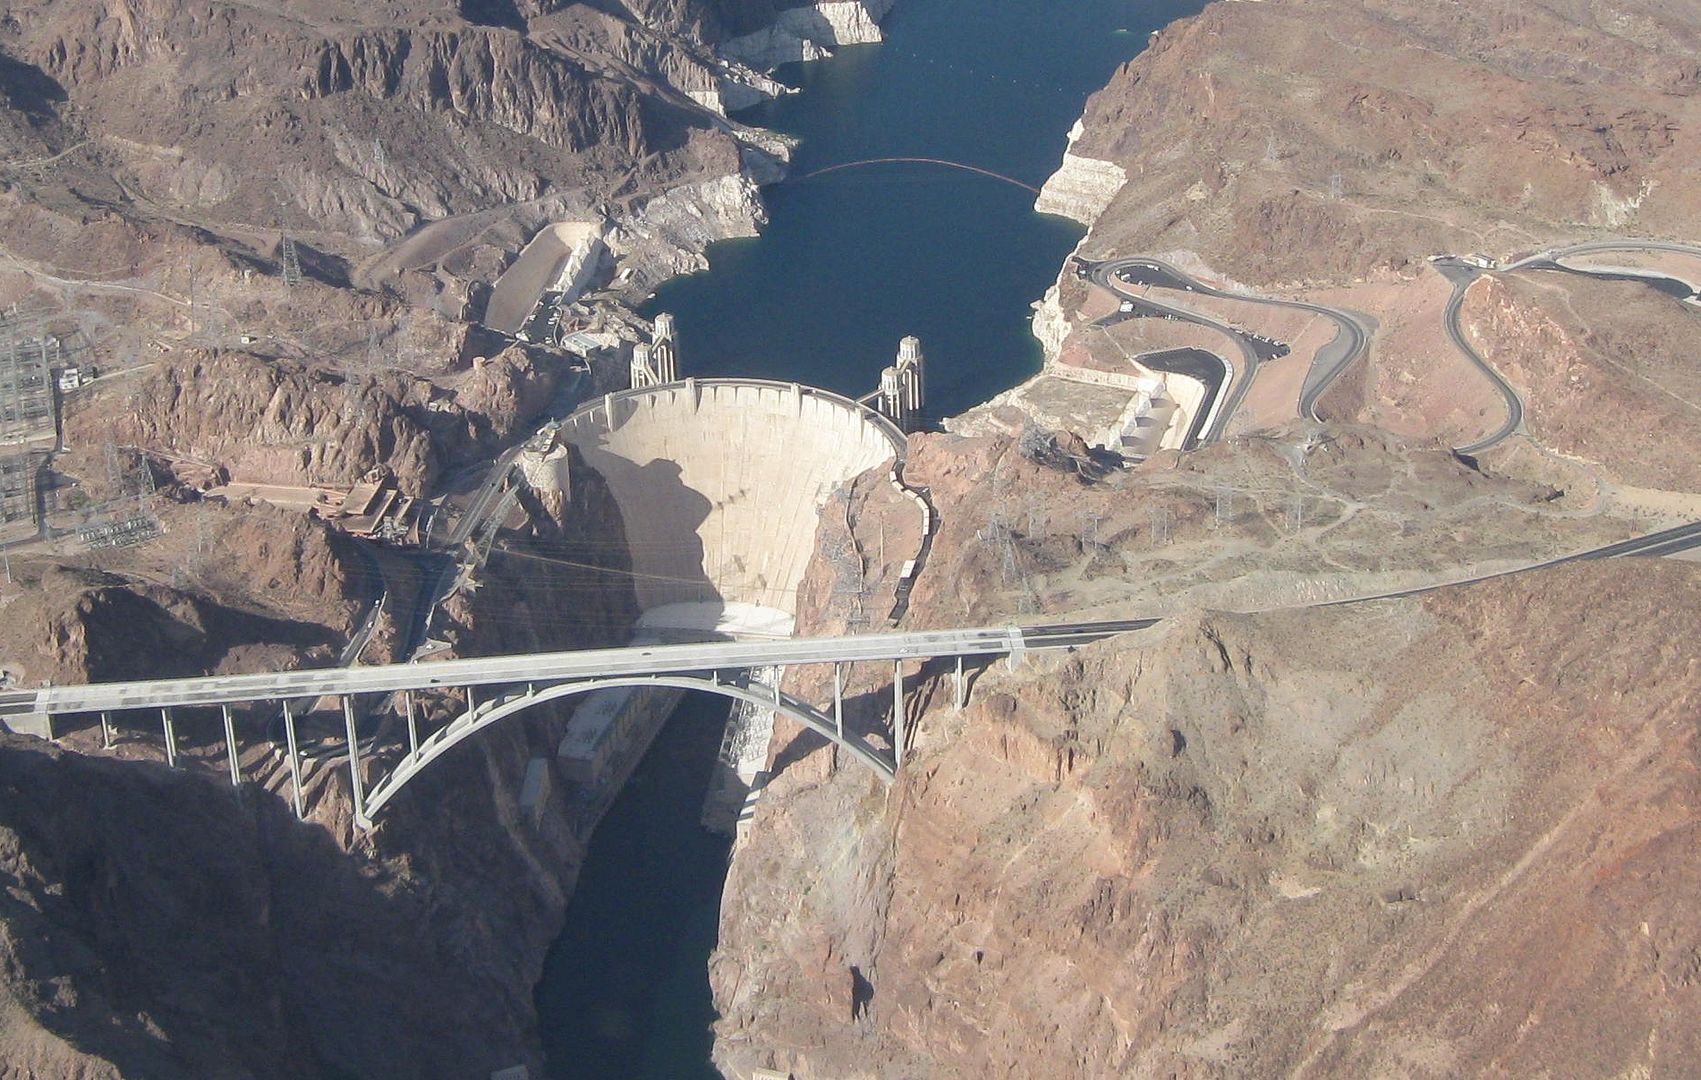
All of this comes on top if negative economic reports from China, Australia, and South Korea. The big picture is one of a global slowdown, with the US economy dragging the rest of the world into the ditch. Many were puzzled by a steady drip, drip of worsening economic news producing rising stock prices for most of last week. But I knew that once you reached the tipping point, the sell orders would pour in like a breached Hoover Dam. That is exactly what we got today.
Of course, it was a great day to follow a particular newsletter that has been pounding the table about the 'RISK OFF' trade for the past six weeks. Once the selling in stocks accelerated, it spilled over to commodities, foreign currencies, oil, junk bonds, and silver, pretty much anything that still had a bid. Treasury bonds and the dollar skyrocketed. It all added up to a one day, 3.5% pop in the value of the Macro Millionaire model portfolio.
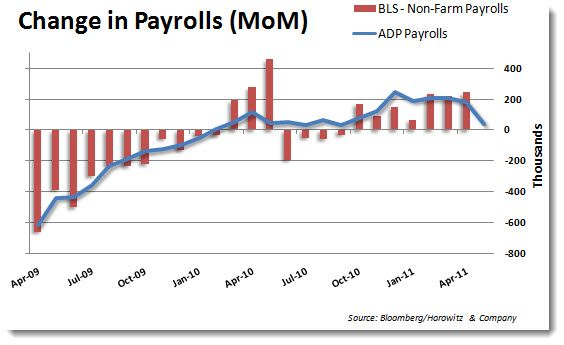
All of this makes this coming Friday's May nonfarm payroll even more interesting, with economists back peddling their estimates so fast, they could well be Lance Armstrong racing in reverse. Goldman Sachs cut their number by a whopping 50,000. Confidence is melting by the second.
-
-
-
Thar She Blows!
-
Which Way Now, Lance?
https://madhedgefundtrader.com/wp-content/uploads/2019/05/cropped-mad-hedge-logo-transparent-192x192_f9578834168ba24df3eb53916a12c882.png00Mad Hedge Fund Traderhttps://madhedgefundtrader.com/wp-content/uploads/2019/05/cropped-mad-hedge-logo-transparent-192x192_f9578834168ba24df3eb53916a12c882.pngMad Hedge Fund Trader2011-06-02 01:50:252011-06-02 01:50:25June 2, 2011 - 'RISK OFF' Returns With a Vengeance
Featured Trades: (RARE EARTHS ARE ABOUT TO BECOME A LOT MORE RARE),
(REMX), (MCP), (AVL), (REE), (LYSCF)
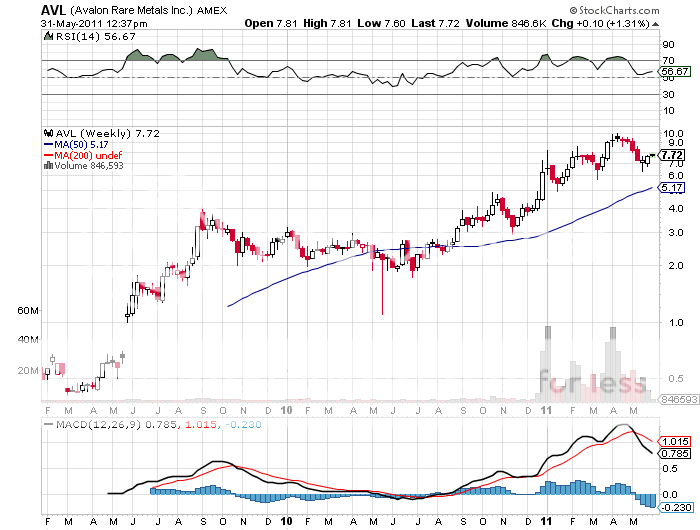
2) Rare Earths Are About to Become a Lot More Rare. Interest in Rare Earths is starting to heat up once again, and it something you should keep on your radar. China's Baotou Steel has announced its intention to start up the world's first rare earths exchange. The move is expected to increase the liquidity and visibility of these valuable elements while reducing their trading costs.
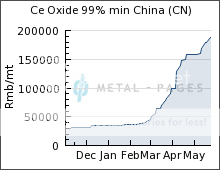
So named because they were hard to get in the 18th and 19th century, these once obscure elements have suddenly become the focus of several converging trends in the global economy, as they are the key ingredient of magnets. There are 17 in all, divided into light (cerium, Ce, lanthanum, La, and neodymium, Nd) and heavy (dysprosium, Dy, terbium, Tb, and europium, Eu). Since the beginning of the year, the price of 99% pure cerium oxide has rocketed by 650% to $11.50 a pound.
It turns out that you can't build a hybrid or electric car, a wind turbine, thin film solar, LED's, high performance batteries, or a cell phone without these elements. One Prius uses 25 kilograms of the stuff. You also can't fight a modern war without rare earths, being essential for radar, missile guidance systems, navigation, and night vision goggles.
That's where things get interesting. China now produces 97% of the world's rare earth supplies, much of it coming from small mines operating by criminal gangs where it is safe to say, concerns about environmental damage are nil. In 2009, China announced that would start restricting rare earth exports, possibly banning several, it is thought, in order to force foreigners to buy more of their downstream electronic products.
Such a ban was temporarily enforced against Japan last fall, when they arrested a hapless Chinese fisherman (spy) who drifted into disputed territorial waters. The ban was lifted when the man was released. Thus, rare earths made their debut at a Chinese political weapon. Similar restrictions could be enforced against the rest of us as early as 2012.
The world market for rare earths is tiny now, amounting to only $4 billion a year. But Toyota intends on doubling its production of Prius's from one million to 2 million units in the near future, while China and South Korea want to boost their combined electric and hybrid production by 1 million units by the end of next year. Nissan is ramping up global manufacturing of its all electric Leaf to 500,000 by next year.
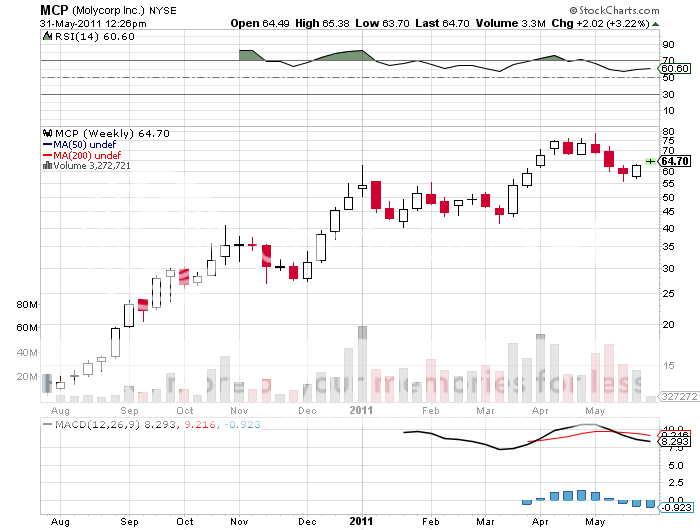
America was once the world's largest producer of these elements, until it was undercut on prices by China (see chart below), and all US production ceased. The threatened Chinese supply squeeze has prompted a group of investors to reopen Molycorp's (MCP) Mountain Pass California mine, a jackrabbit ridden, rattlesnake infested pit an hour southwest of Las Vegas. The mine was the world's largest producer of cerium and neodymium, and provided the europium that was used to produce the first color televisions.
Last August, Molycorp? raised $500 million through an IPO to reopen the mine and a nearby refinery at $15 a share. It briefly dipped to $12.50 where I got everybody in, and then soared to $79, making it the top performing IPO for 2010. Further fuel was added to the fire with the launch of the first rare earth ETF, Market Vectors Rare Earths/Strategic Metals (REMX) in November.
Now congress wants to get involved, proposing a rare earths strategic stockpile for the military, and offering subsidized loans to fund it. Remember what that did for oil? The price has already started with cerium doubling to $4/pound since 2007, and neodymium up 500% to $23/pound during the same period.
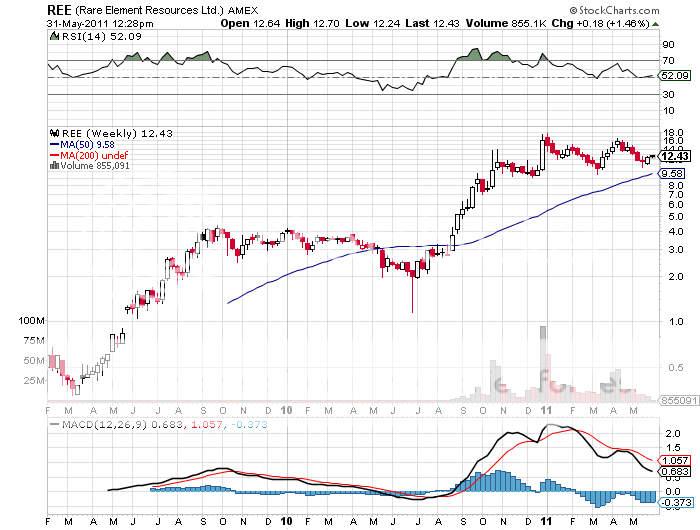
So it might be wise to use the next generalized equity sell off to dip your toe back into the rare earths pool. The best way to get involved is through the miners themselves, which involves an added element of risk. Take a look at the established players, which include Molycorp (MCP), Avalon Rare Metals (AVL), Rare Element Resources (REE), and Lynas Corp (LYSCF).
-
-
-
-
-
https://madhedgefundtrader.com/wp-content/uploads/2019/05/cropped-mad-hedge-logo-transparent-192x192_f9578834168ba24df3eb53916a12c882.png00Mad Hedge Fund Traderhttps://madhedgefundtrader.com/wp-content/uploads/2019/05/cropped-mad-hedge-logo-transparent-192x192_f9578834168ba24df3eb53916a12c882.pngMad Hedge Fund Trader2011-06-01 01:50:012011-06-01 01:50:01June 1, 2011 - Rare Earths Are About to Become a Lot More Rare
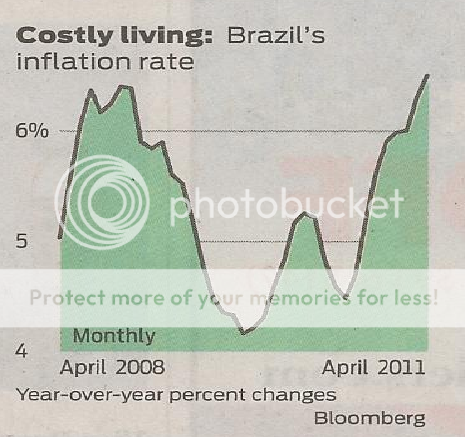
3) The One Economic Indicator You Can Rely On. There is no end to which I am willing to go to understand the future direction of the world economy. So when I learned that the price of Brazilian bikini waxes was going through the roof, I had to sit up and take note. Last month, the price of the popular beauty treatment soared by 16.6% to 35 Reals, about $22.
This is no joke. The Brazilian government includes the removal of body hair in the most strategic of places in a basket of consumer services that it uses in calculating the country's inflation rate, now estimated at 6.5%. An economist in Rio de Janeiro assured me that this has nothing to do with the opposite sex. It is one of the few measures they track which can't be clouded through the surreptitious altering of its quantity or quality. You either get it, or you don't.
The big picture here is that inflation is worsening, not only in Brazil, but other emerging markets, like China, India, and Vietnam. This is why the yields on one year Brazilian debt are at sky high double digits, a hedge fund favorite. It is also why the People's Bank of China's efforts to stanch inflation through higher interest rates and tightened bank reserve requirements are likely to get worse before are gets better.
What can I say? An economic indicator in the hand is worth two in the bush? And I won't even get into the implications of 'Stealth' inflation.
-
https://madhedgefundtrader.com/wp-content/uploads/2019/05/cropped-mad-hedge-logo-transparent-192x192_f9578834168ba24df3eb53916a12c882.png00Mad Hedge Fund Traderhttps://madhedgefundtrader.com/wp-content/uploads/2019/05/cropped-mad-hedge-logo-transparent-192x192_f9578834168ba24df3eb53916a12c882.pngMad Hedge Fund Trader2011-06-01 01:40:482011-06-01 01:40:48June 1, 2011 - The One Economic Indicator You Can Rely On
'I think the price of oil is high here. There is still some panic because of Libya. We prefer to have it around $70-$80 a barrel. Our goal is the find an equilibrium between our needs and your needs' said Prince Al-Waleed bin Talal of Saudi Arabia, the largest foreign investor in the US.
https://madhedgefundtrader.com/wp-content/uploads/2019/05/cropped-mad-hedge-logo-transparent-192x192_f9578834168ba24df3eb53916a12c882.png00Mad Hedge Fund Traderhttps://madhedgefundtrader.com/wp-content/uploads/2019/05/cropped-mad-hedge-logo-transparent-192x192_f9578834168ba24df3eb53916a12c882.pngMad Hedge Fund Trader2011-06-01 01:00:192011-06-01 01:00:19June 1, 2011 - Quote of the Day
Featured Trades: (IS JAPAN GETTING READY TO BLOOM?),
(TM), (NSANY), (FANUY), (CAJ), (KMTUY), (FXJ),(YCS)
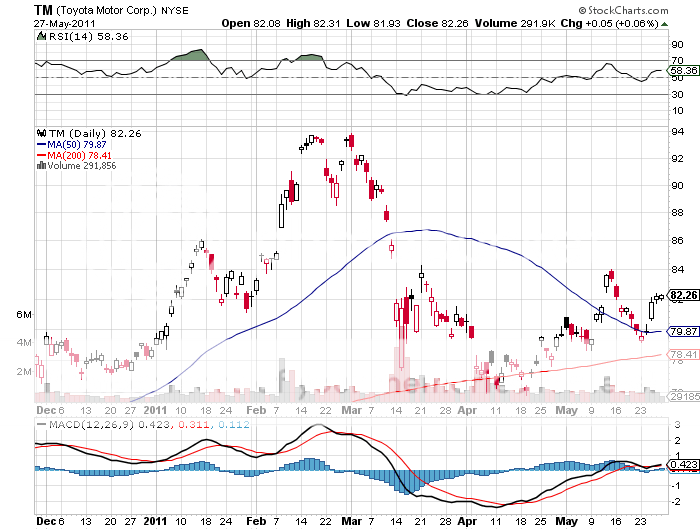
1) When to Buy Japan? It has been three months since the horrific Japanese tsunami, the economy is in free fall, and radiation is still lingering in the air and water. It now appears that the beleaguered nation's GDP shrank at a 4% rate, in line with my own expectations, but far worse than anyone else's. The down leg of the 'V' is well underway. When does the up leg begin, and when should we start positioning for it?
One need look no further than Toyota's Motor's stunning year on year decline in domestic sales of -69%. Consumers in the US want to buy their fuel efficient cars, but sought after models are in short supply. Power shortages have been a major headache, and additional nuclear shut downs have exacerbated the problem. A 28 week, $60 billion buying spree of Japanese stocks has ground to a halt, taking the Nikkei down 10%.
The government has already passed two supplementary budgets to get reconstruction underway, one for $50 billion and a second for $125 billion. The Bank of Japan has carried out quantitative easing worth $500 billion; nearly triple the Federal Reserve's own recent QE2 efforts on a per capita basis.
Surging loan demand indicates that these efforts are yielding their desired results. Companies are moving away from their famous kamban 'just in time' inventory system towards a 'just in case' model that provides a bigger buffer against unanticipated disasters. This is a net positive for the economy.
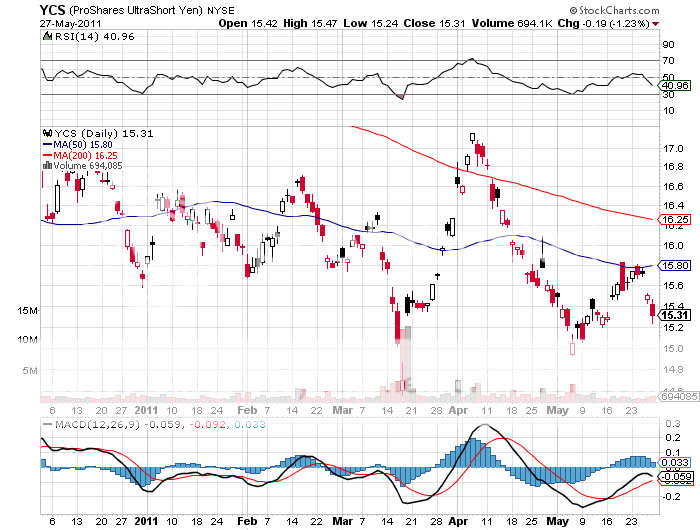
This Godzilla sized stimulus is expected to deliver GDP growth in 2012 as high as 3%, taking it to the top of the pack of developed nations. That will prompt rally of at least 20% in the Japanese stock market. What's more, widening interest rate differentials between Japan and the US should finally start to weaken the yen, giving a further boost to the economy and to stocks. This burst in business activity should also enable the country to flip from chronic deflation to inflation, and will?? knock the wind out of Japanese government bonds, now yielding a pitiful 1.11% for the ten year.
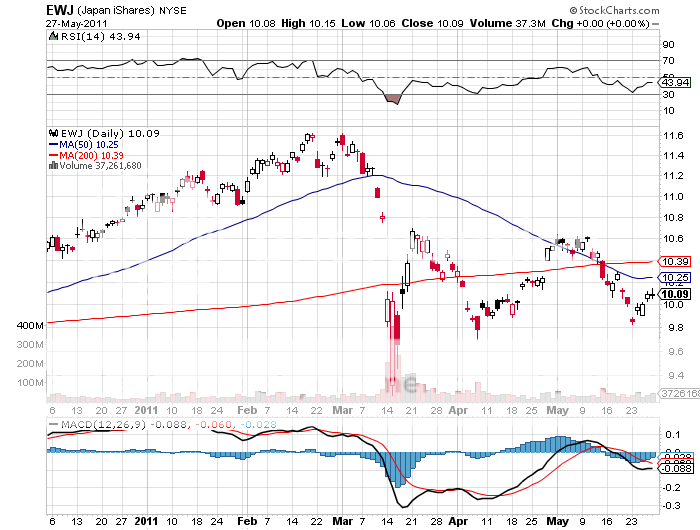
So when do we pull the trigger? If my theory is correct and we get a multi month 'RISK OFF' trade that deflates all asset prices, then you want to hold off for now. But I can see a final bottoming of prices sometime this summer. The easy play here is to buy the ETF (EWJ).
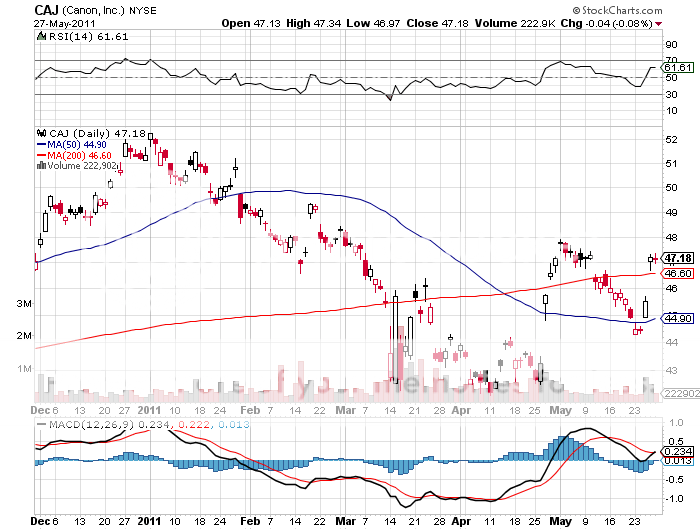
The next level of commitment includes the five best of blue chips I mentioned in March, Toyota Motors, (TM), Nissan Motors (NSANY), Fanuc (FANUY), Canon (CAJ), and Komatsu (KMTUY). Keep in mind that you will want to hedge your currency here through buying puts on the (FXJ) and through the 2X (YCS), as a weak yen will be part of a winning recipe.
-
-
-
-
Is Japan Getting Ready to Bloom?
https://madhedgefundtrader.com/wp-content/uploads/2019/05/cropped-mad-hedge-logo-transparent-192x192_f9578834168ba24df3eb53916a12c882.png00Mad Hedge Fund Traderhttps://madhedgefundtrader.com/wp-content/uploads/2019/05/cropped-mad-hedge-logo-transparent-192x192_f9578834168ba24df3eb53916a12c882.pngMad Hedge Fund Trader2011-05-31 02:00:282011-05-31 02:00:28May 31, 2011 - When to Buy Japan?
Legal Disclaimer
There is a very high degree of risk involved in trading. Past results are not indicative of future returns. MadHedgeFundTrader.com and all individuals affiliated with this site assume no responsibilities for your trading and investment results. The indicators, strategies, columns, articles and all other features are for educational purposes only and should not be construed as investment advice. Information for futures trading observations are obtained from sources believed to be reliable, but we do not warrant its completeness or accuracy, or warrant any results from the use of the information. Your use of the trading observations is entirely at your own risk and it is your sole responsibility to evaluate the accuracy, completeness and usefulness of the information. You must assess the risk of any trade with your broker and make your own independent decisions regarding any securities mentioned herein. Affiliates of MadHedgeFundTrader.com may have a position or effect transactions in the securities described herein (or options thereon) and/or otherwise employ trading strategies that may be consistent or inconsistent with the provided strategies.