(MARKETS HAVE A LOT OF DATA TO DIGEST THIS WEEK)
April 8, 2024
Hello everyone,
Week ahead calendar
Monday, April 8
Switzerland Unemployment Rate
Previous: 2.4%
Time: 1:45 am
Tuesday, April 9
6 a.m. NFIB Small Business Index (March)
Japan Consumer Confidence
Previous: 39.1
Time: 1:00 am
Wednesday, April 10
8:30 a.m. Consumer Price Index (CPI) (March)
8:30 a.m. Hourly Earnings final (March)
8:30 a.m. Average Workweek final (March)
10 a.m. Wholesale Inventories final (February)
2:00 p.m. Treasury Budget NSA (March)
2:00 p.m. FOMC Minutes
Earnings: Delta Air Lines
Thursday, April 11
8:30 a.m. Continuing Jobless Claims (3/30)
8:30 a.m. Initial Claims (04/06)
8:30 a.m. Producer Price Index PPI
Euro Area Interest Rate Decision
Previous: 4.5%
Time: 8:15 am
Earnings: CarMax
Friday, April 12
8:30 a.m. Export Price Index (March)
8:30 a.m. Import Price Index (March)
10 a.m. Michigan Sentiment preliminary (April)
UK GDP Growth Rate
Previous: -0.3%
Time: 2:00 am
Earnings: State Street, Wells Fargo, JPMorgan Chase, Progressive, Citigroup
Top of mind for investors this week will be inflation numbers that are out on Wednesday. Markets are already digesting rising Treasury yields, so the data could provide an added dose of medicine that the market may love or just really hate.
The numbers will confirm whether we are headed towards the Fed’s 2% target or whether a reassessment or shift is needed on interest rate policy and outlook. Even if March numbers are good, investors should still remain cautious about where inflation will sit in the months ahead.
The number of jobs added to the U.S. economy in March was beyond expectations, really highlighting the labour market’s strength. Of significance, however, was the fact that average hourly earnings were in line with forecasts, suggesting that the labour market and the economy as a whole are not overheating. Currently, the CME Fed Watch Tool shows markets are pricing in three rate cuts this year, starting in June. Wait for the data; it will tell a story.
The markets are feeling brittle about yields, and any further negative data could tip us into a little more volatility, and more of a correction here.
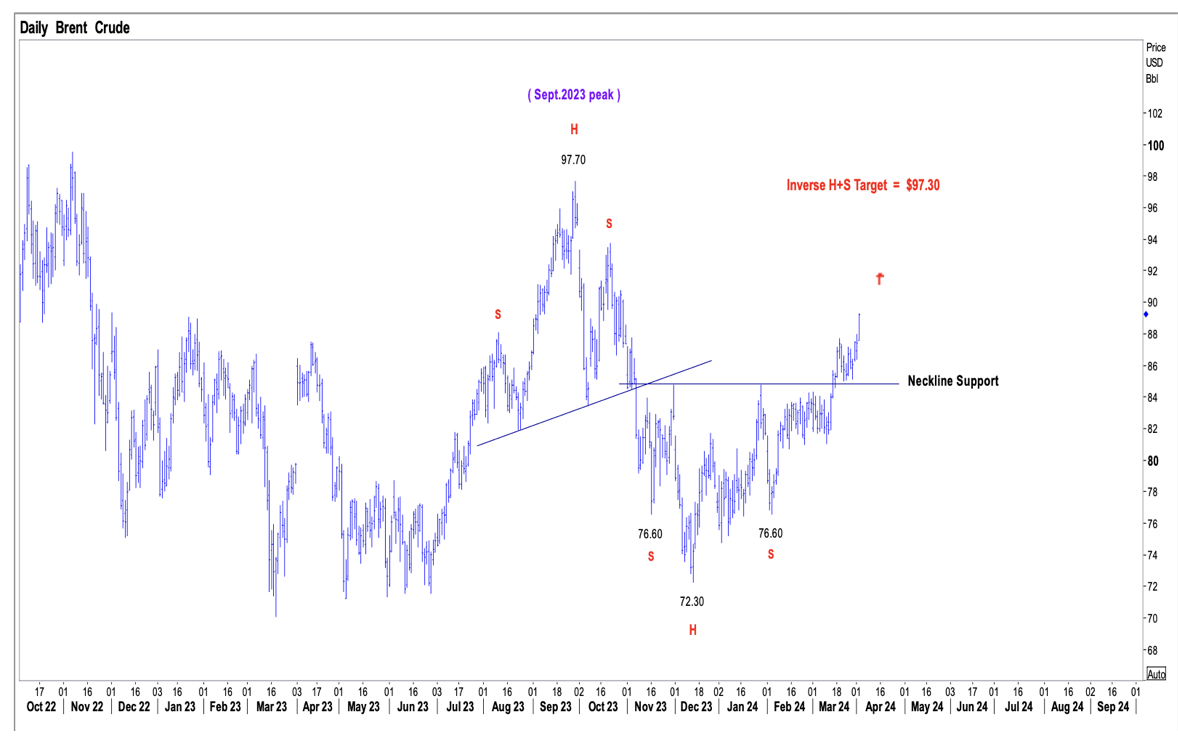
Rising Treasury yields and higher oil prices saw the DJIA close lower by 2.3% last week. West Texas Intermediate crude oil futures topped $87 a barrel last week, reaching a five-month high. The 10-year Treasury yield hit 4.4% last Friday.
Despite these readings, many investors remain optimistic that stocks can continue to rally, citing a broadening out in the rally – meaning that it is not just the tech sector leading the rally, but a participation of all sectors – and a strong economy, which are constructive signals for markets.
The market’s “Bigger Picture” outlook remains Bullish. We would need to see a strong break below 5,140 to signal a deeper retracement back towards the 4990 area.
The uptrend in Gold and Silver remains in progress, and we are awaiting a breakout from a symmetrical triangle in Bitcoin, with a target of around $82,000.

Cheers,
Jacquie