In 2013, the Mad Hedge Fund Trader Trade Alert Service delivered a blowout return of 68% for followers. As I present my Global Strategy luncheons around the world, I am learning that many made much more.
I am therefore raising the price for our flagship product, Mad Hedge Fund Trader Pro, by $500 to $4,500 a year and Mad Day Trader to $2,500 a year or $859 per quarter. We have not seen a price increase in two years and are overdue, given the red hot numbers that I have been delivering.
The service includes my daily newsletter, the Trade Alert service, biweekly Global Strategy Webinars, invitations to strategy luncheons, and search ability for my 3 million word research data base. It also includes Jim Parker?s Mad Day Trader running market commentary, his Trade Alert service, and brand new TheOpening Bell with Jim Parker.
To show how much we appreciate our most loyal and long-term customers, we are going to make a special one time only offer. If you upgrade now, we will honor our old prices until June 1. You can still purchase Mad Hedge Fund Trader Pro for a bargain $4,000 for another year of outstanding service, or Mad Day Trader as a stand alone product for $2,000 or $699 for 3 months.
Place your order online which will add an additional year to your existing subscription.? If you need assistance just email Nancy at customer support at support@madhedgefundtrader.com, or call her directly at 888-716-1115 east coast time.
Because of overwhelming demand, I am taking my hard-earned profits to reinvest in the business to improve the quantity and quality even more. My goal is to advance your education about the markets, raise your level of financial sophistication, and to level the playing field with Wall Street.
This will give you the ability to place your own trades with confidence. In other words, I am teaching you how to fish, instead of relying on the aged product they sell at Safeway.
Your Emails Will Be Answered Promptly
https://www.madhedgefundtrader.com/wp-content/uploads/2014/05/John-Thomas4.jpg339309Mad Hedge Fund Traderhttps://madhedgefundtrader.com/wp-content/uploads/2019/05/cropped-mad-hedge-logo-transparent-192x192_f9578834168ba24df3eb53916a12c882.pngMad Hedge Fund Trader2014-05-27 12:15:452014-05-27 12:15:45Buy Now to Beat the Price Increase
Featured Trade: (JUNE 26 ISTANBUL, TURKEY STRATEGY LUNCHEON) (THE GAME CHANGER IN INDIA), (INP), (PIN), (EPI), (EEM), (CEW), (ELD), (USO), (KOL), (CU), (GLD), (INDIA IS CATCHING UP WITH CHINA)
iPath MSCI India Index ETN (INP)
PowerShares India (PIN)
WisdomTree India Earnings (EPI)
iShares MSCI Emerging Markets (EEM)
WisdomTree Emerging Currency Strategy (CEW)
WisdomTree Emerging Markets Local Debt (ELD)
United States Oil (USO)
Market Vectors Coal ETF (KOL)
First Trust ISE Global Copper Index (CU)
SPDR Gold Shares (GLD)
https://madhedgefundtrader.com/wp-content/uploads/2019/05/cropped-mad-hedge-logo-transparent-192x192_f9578834168ba24df3eb53916a12c882.png00Mad Hedge Fund Traderhttps://madhedgefundtrader.com/wp-content/uploads/2019/05/cropped-mad-hedge-logo-transparent-192x192_f9578834168ba24df3eb53916a12c882.pngMad Hedge Fund Trader2014-05-22 01:06:052014-05-22 01:06:05May 22, 2014
?Give us all your money,? said the largest of the three men who snuck up behind me at the entrance to the Orlando Marriott World Hotel. It was 1:30 AM, pitch dark, and the area was abandoned.
I had my wallet out to pay the taxi driver, brimming with $5,000 in cash, my winnings at the blackjack tables at the just completed SALT conference in Las Vegas. He took off like a shot, and I was left standing there, alone.
I turned around, put my wallet in my back pocket, took off my horn rimmed glasses and said, in my most intimidating, ?I?m going to kick your ass? manner possible, ?Trying this on a Marine with post traumatic stress is a really bad idea.? The three would be muggers backed up as fast as they could and disappeared into the swamps.
It?s all about attitude.
I mentioned the incident to the hotel staff while checking in. They were horrified, apologized profusely, and gave me a triple upgrade to the presidential suite with a $100 room service credit.
Welcome to Orlando!
I was making a 24 hour pit stop in the Sunshine State to give the good news about where the financial markets will be in 2030 to a conference of top performing independent investment advisors. After knocking their socks off, I felt I had just made several lifetime friends.
I even got to trade war stories with a fellow Dessert Storm pilot who flew OV-10 twin tailed Broncos. Once, in Kuwait I was with a Marine ground unit that came under fire. The NCO said, ?Don?t worry, the Broncos are inbound.? When I heard the BRRRRRR of its M60 machine guns, it sounded like music to my ears. I thanked him for his service, and saving my ass.
This being the heart of the Deep South and the former confederacy, I was questioned about my California politics. I told my audience they had a choice. They could listen to Fox News all day, read the conspiracy theories in the Drudge Report, and live in a permanent state of anger.
Or they could work with a guy with inside access like me, gain insights into the administrations actual thinking, and learn what they are really going to do. I hand out ticker symbols too. I suggested that the latter generated a better investment return for clients, and most agreed.
The reality is that most of the country agrees on 99% of everything I told them. It is only the media (better ratings), fundraisers (more money), and politicians (more votes) who are driving us to our corners, and the internet gives everybody flame thrower.
I also get the opportunity to influence the course of events in my own small way. The White House Staff, The Treasury Secretary, the Chairman of the Federal Reserve, the Secretary of State, the Joint Chiefs of Staff, and the Director of the CIA don?t spend time with me because I wear nice Italian suits and tell funny jokes.
You can almost count on one hand the number of people around who have been refining a global economic and political view for nearly half a century.
I also said I really loved their key lime pie and pecan pralines.
It was one of those non-stop days. After a scant four hours of sleep I was up at 7:00 AM for breakfast, delivered a 90 minute keynote speech at 8:00, and followed that up with a Global Strategy Luncheon with some of my oldest most loyal and newly enriched readers.
One made more than the 68% last year following my Trade Alerts. Then I hauled my lunch guests back into the conference to listen to me participate in a panel discussion.
I ended the day meeting with my own national staff in my greatly upsized suite, who flew in from around the country. Mad Day Trader Jim Parker was happy to flee Chicago for a day. Nancy of operations was there as fresh faced as always, as was Doug the Web developer, who we are now calling ?the lumberjack,? since he has a beard and lives in the middle of nowhere in remote Vermont.
We devised a series of new groundbreaking products, which you will be hearing about shortly. Such is life on the cutting edge of online financial education. Oh, and prices are going up too, as befits our industry beating performance.
I caught an early dinner with an old hedge fund buddy from Tampa, discussing the current state of the world. Then it was back to the hotel for an extended drinking session with the staff, who are indispensable in helping me run my global media empire.
No rest for the wicked.
By the way, I am writing all this to you from first class seat 2C on Virgin America flight VX 305, nonstop from Orlando to San Francisco. It is a perfect day, and we have just crossed the vast expanse of the ?Big Muddy,? Mark Twain?s home waters, known to you all as the Mississippi River.
I mentioned to the pilot that with my frequent flier points and platinum status the crew should have lined up and saluted when I came on board. They laughed. Then I asked if he noticed the old Strategic Air Command B-52 bomber at the airport entrance.
He said he did, and that he had worked on the birds as a senior tech in the old days, charged with arming the nuclear warheads on the cruise missiles. He was amazed when I told him the Germans designed the Stratofortress during WWII so they could bomb New York.
They never built it, but the Americans did when they found the plans at the end of the war. Out of the original fleet of 500, 75 still fly, and the Air Force intends to keep flying them until 2050, when they will be 100 years old. No kidding. A lot of Air Force pilots still say it was the best plane ever designed.
Got to love Boeing Aircraft (BA). Made in the USA.
I recounted my own stories of flying on nuclear armed missions from Anderson Air Force Base on Guam in the Pacific to North Korea, only to turn around ten minutes before we entered their air space.
We did this every Monday-Thursday, dropped conventional 500 pound bombs at a Western Australian missile range on Fridays, and took the weekends off to drink beer on pristine Tauragi beech, mindful of the armed Japanese soldiers still lurking in the jungle nearby. This was 1973.
There were no windows for the ten-hour flight. Even the front windshield carried removable steel blast shields. Good thing they always carried a spare coffee maker.
The message to the Kim Il-sung regime was clear. Be nice, or we fly the extra ten minutes. President Teddy Roosevelt (I met his oldest daughter Alice, no kidding, again!), wisely called this ?walking softly, but carrying a big stick.? Well, maybe not so softly.
The flight out was uneventful. I noticed that the older passenger next to me was wearing an $8,000 Brioni jacket identical to mine, so I complimented him on his taste in clothing. He turned out to be the head of the Neurology Department at the University of Arizona Medical School, so we spent three hours discussing the ins and outs of Obamacare. It turned a long flight into a short flight.
Bottom line? It?s going to work, give the health care industry a long overdue shake up, unleash free market competition, and improve the quality of care for all, while reducing the costs. But it may take a decade to work out the kinks. Expect a lot of disruption until then.
I added that it was also creating the investment opportunity of the decade. He said ?Oh?? and I gave him a handful of ticker symbols Gilead Sciences (GILD), the iShares Biotech ETF (IBB), Pfizer (PFE), and HCA Holdings (HCA). These doctors, so smart, yet so useless when it comes to managing their own money.
I asked if these views were controversial in ultra red state Arizona, and he said ?yes.? But at a certain point, people of all political persuasions just want the facts so they can get on with their lives. So true, so true.
We then talked about what a great guy Barry Goldwater was (another bomber pilot, B-25?s), and how his political career was ended by an unfair Johnson smear campaign (the little girl counting down the petals of a flower until a hydrogen bomb went off in the background).
Some things never change.
As is my way, I then convinced him to give me a complete physical while remaining in my seat. Was hiking 2,000 miles a year in the mountains with a 60 pound pack killing me? Was it doing more damage to my poor aging body than it was worth?
He gave me the once over. At 45 beats a minute, I had the resting heart rate of a teenaged Olympic athlete. My blood pressure at 110/70 was fabulous. Even the big toe that I froze in a high altitude blizzard last winter and was still black would get better (?That toenail really looks like it wants to come off?) (the other first class passengers are now looking over curiously). The knees would get better over my summer break. He said whatever I was doing, I should keep doing it.
It looks like I will be around for a while.
The passenger in the other seat next to me was a stunning 6?1? blonde from Atlanta. After Stacy read my website through the onboard Wi-Fi, she handed me her business card with her cell number scratched on the back.
I?m not the player I was in decades past, but it is still nice to get this kind of attention when you are Social Security age. Now I know why they call them Southern Belles.
We just crossed the snow covered High Sierras and have begun our descent into San Francisco. It?s time to fold up my laptop and fasten my seatbelt.
I?m sorry, this is turning into a bit of a ramble, but it is a long flight. This is my life, a never-ending series of utterly fascinating conversations about everything with everybody. It seems there is now a shapely brunette in the seat behind me who also wants my business card.
See you at my weekly Global Strategy webinar on Wednesday.
Wink. Wink.
OV-10 Bronco Light Attack Aircraft
https://www.madhedgefundtrader.com/wp-content/uploads/2014/05/John-Thomas3.jpg344361Mad Hedge Fund Traderhttps://madhedgefundtrader.com/wp-content/uploads/2019/05/cropped-mad-hedge-logo-transparent-192x192_f9578834168ba24df3eb53916a12c882.pngMad Hedge Fund Trader2014-05-21 01:03:442014-05-21 01:03:44Back at the Ranch
Featured Trade: (LAST CHANCE TO ATTEND THE CHICAGO FRIDAY, MAY 23 GLOBAL STRATEGY LUNCHEON), (REPORT ON THE 6th ANNUAL SKYBRIDGE ALTERNATIVES (SALT) CONFERENCE)
https://madhedgefundtrader.com/wp-content/uploads/2019/05/cropped-mad-hedge-logo-transparent-192x192_f9578834168ba24df3eb53916a12c882.png00Mad Hedge Fund Traderhttps://madhedgefundtrader.com/wp-content/uploads/2019/05/cropped-mad-hedge-logo-transparent-192x192_f9578834168ba24df3eb53916a12c882.pngMad Hedge Fund Trader2014-05-20 01:05:382014-05-20 01:05:38May 20, 2014
Featured Trade:
(JUNE 17 NEW YORK STRATEGY LUNCHEON),
(MAY 21 GLOBAL STRATEGY WEBINAR),
(COME TO THE JUNE 13-14 INVEST LIKE A MONSTER LAS VEGAS CONFERENCE)
https://madhedgefundtrader.com/wp-content/uploads/2019/05/cropped-mad-hedge-logo-transparent-192x192_f9578834168ba24df3eb53916a12c882.png00Mad Hedge Fund Traderhttps://madhedgefundtrader.com/wp-content/uploads/2019/05/cropped-mad-hedge-logo-transparent-192x192_f9578834168ba24df3eb53916a12c882.pngMad Hedge Fund Trader2014-05-19 01:06:572014-05-19 01:06:57May 19, 2014
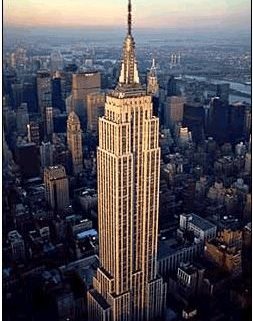
Come join Mad Day Trader Jim Parker and I for lunch at the Mad Hedge Fund Trader?s Global Strategy Luncheon, which we will be conducting in New York, NY on Tuesday, June 17, 2014. An excellent three course lunch will be provided. A PowerPoint presentation will be followed by an extended question and answer period.
I?ll be giving you my up to date view on stocks, bonds, foreign currencies, commodities, precious metals, and real estate. And to keep you in suspense, I?ll be throwing a few surprises out there too. Enough charts, tables, graphs, and statistics will be thrown at you to keep your ears ringing for a week. Tickets are available for $248.
The formal luncheon will run from 12:00 to 2:00 PM. I?ll be arriving an hour early and leaving late in case anyone wants to have a one on one discussion, or just sit around and chew the fat about the financial markets.
The event will be held at a prestigious private club on Central Park South, the details of which will be emailed to you with your purchase confirmation.
I look forward to meeting you, and thank you for supporting my research. To purchase tickets for the luncheons, please go to my online store.
https://www.madhedgefundtrader.com/wp-content/uploads/2013/04/Empire-State-Building.jpg380253Mad Hedge Fund Traderhttps://madhedgefundtrader.com/wp-content/uploads/2019/05/cropped-mad-hedge-logo-transparent-192x192_f9578834168ba24df3eb53916a12c882.pngMad Hedge Fund Trader2014-05-19 01:05:452014-05-19 01:05:45Meet John Thomas and Jim Parker in New York on June 17
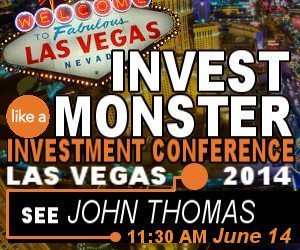
Please come to hear me,?Mad Hedge Fund Trader?John Thomas, as the keynote speaker at the?Invest Like a Monster Las Vegas Conference?on June 13-14.
I will be joined by many old friends from across the investment spectrum. Jon and Pete Najarian will teach you the tricks of the trade for navigating the ever complex options markets.
Fellow former combat pilot, Chuck Hughes, will go into depth on his own highly successful approach to trading the market. To listen to my in depth interview with him on?Hedge Fund Radio, please?click here.
Well known market commentator Guy Adami, the Prince of New Jersey, will be there to give his trading insights. So will former hedge fund manager and Yahoo Finance guru Jeff Macke.
The first day will be devoted to three educational sessions that get into the nitty gritty of trading options. The day winds up with a cocktail party with the Najarian Brothers and me.
I will kick off the Saturday session with and extended presentation on the long-term future of the financial markets, to be followed by an extensive question and answer session. I will be followed by an impressive lineup of market veterans.
The event will be held at the?Bellagio Hotel?on the Strip, my favorite Las Vegas haunt, best known for its spectacular water fountains out front. You may recognize it in the hit movies?The Hangover?and?Ocean?s Eleven.
General admission costs $499 for the two full days. You can buy a VIP ticket for $699, which includes social events with the high and the mighty. It is all great value for the money, given the quality and quantity of the information you will obtain. Just click here: http://www.optionmonster.com/events/?refId=186?to buy tickets.
Trademonster?s proprietary program, called Heat Seeker ?, monitors no less than 180,000 trades a second to give an early warning of large trades that are about to hit the stock, options, and futures markets. To give you an idea of how much data this is, think of downloading the entire contents of the Library of Congress, about 20 terabytes, every 33 minutes.
The firm maintains a 10 gigabyte per second conduit that transfers data at 6,000 times the speed of a T-1 line, the fastest such pipe in the civilian world. The firm then distills this ocean of data into the top movers of the day, which is put up for free on its website, and offers much more detailed analysis through a premium subscription product.
?As with the NFL,? says Jon, ?you can?t defend against speed?. The system catches big hedge funds, pension funds, and mutual funds shifting large positions, giving subscribers a peak at the bullish or bearish tilt of the market. It also offers accurate predictions of imminent moves in single stock and index volatility.
Jon started his career as a linebacker for the Chicago Bears, and I can personally attest that he still has a handshake that?s like a steel vice grip. Maybe it was his brute strength that enabled him to work as pit trader on the Chicago Board of Options Exchange for 22 years, where he was known by his floor call letters of ?DRJ.? He formed Mercury Trading in 1989 and then sold it to the mega hedge fund, Citadel, in 2004.
Jon developed his patented algorithms for Heat Seeker? with his brother Pete, another NFL player (Tampa Bay Buccaneers and the Minnesota Vikings), who like Jon, is a regular face in the financial media.
June is a great time to visit Sin City, as the crowds are largely gone and the sun is wonderfully baking hot. You can ride the neck-breaking roller coaster at the New York New York Hotel, catch one of eight?Cirque du Soleil?shows, and ride a gondola at the Venetian Hotel.
Or you can try to get a great deal on a luxury item from my buddy, Rick Harrison, at the famous?Gold and Silver Pawn, of?Pawn Stars?fame (good luck with that!).
Just be sure to bring extra sun tan lotion!
Hanging with the Big Dogs in Vegas
https://www.madhedgefundtrader.com/wp-content/uploads/2014/03/ilam-lasvegas-baby.jpg250300Mad Hedge Fund Traderhttps://madhedgefundtrader.com/wp-content/uploads/2019/05/cropped-mad-hedge-logo-transparent-192x192_f9578834168ba24df3eb53916a12c882.pngMad Hedge Fund Trader2014-05-19 01:03:572014-05-19 01:03:57Come to the June 13-14 Invest Like a Monster Las Vegas Conference
Featured Trade: (AN EVENING WITH DAVID TEPPER), (SPY), (QQQ), (IWM) (TLT), (FXE) (MAY 21 GLOBAL STRATEGY WEBINAR)
SPDR S&P 500 (SPY)
PowerShares QQQ (QQQ)
iShares Russell 2000 (IWM)
iShares 20+ Year Treasury Bond (TLT)
CurrencyShares Euro Trust (FXE)
https://madhedgefundtrader.com/wp-content/uploads/2019/05/cropped-mad-hedge-logo-transparent-192x192_f9578834168ba24df3eb53916a12c882.png00Mad Hedge Fund Traderhttps://madhedgefundtrader.com/wp-content/uploads/2019/05/cropped-mad-hedge-logo-transparent-192x192_f9578834168ba24df3eb53916a12c882.pngMad Hedge Fund Trader2014-05-16 01:05:432014-05-16 01:05:43May 16, 2014
Legal Disclaimer
There is a very high degree of risk involved in trading. Past results are not indicative of future returns. MadHedgeFundTrader.com and all individuals affiliated with this site assume no responsibilities for your trading and investment results. The indicators, strategies, columns, articles and all other features are for educational purposes only and should not be construed as investment advice. Information for futures trading observations are obtained from sources believed to be reliable, but we do not warrant its completeness or accuracy, or warrant any results from the use of the information. Your use of the trading observations is entirely at your own risk and it is your sole responsibility to evaluate the accuracy, completeness and usefulness of the information. You must assess the risk of any trade with your broker and make your own independent decisions regarding any securities mentioned herein. Affiliates of MadHedgeFundTrader.com may have a position or effect transactions in the securities described herein (or options thereon) and/or otherwise employ trading strategies that may be consistent or inconsistent with the provided strategies.