I?m half mad with jet lag, and I haven?t pooped in three days. But I?m back from the magical Land Down Under.
It was another one of those incredible, once in a lifetime, bucket list type trips. The highlight was flying my own plane out to a small speck of a coral island 40 miles at sea in the Great Barrier Reef National Park.
There I spotted electric blue starfish, snapping moray eels, a pod of dolphins, rode the back of a giant sea turtle, and swam with giant manta rays and reef sharks. Strangely, I felt right at home with the sharks, perhaps a byproduct of my day job?
I planned to ease my way back into the market, waiting for the next sweet spot to get my feet wet. But what did I get? Natural gas (UNG) opened on a spike at $28. To quote William Shakespeare, ?They must be out of their F?? mind.? Out went the Trade Alert to buy the July puts, this time at the $26 strike. They promptly obliged by rocketing 20% in value in hours, adding an immediate 100 basis points to our performance this year, taking me to yet another new performance all time high. Well, maybe Shakespeare really didn?t say that, but I did.
I followed up with another aggressive long in Bank of America (BAC). After that, a denial of service attack took down our email distribution provider, so that was it for the day. Welcome back to the fast lane.
I will write at greater length in the near future about my adventures in the Antipodes, of which there were many. Until then, I will be working with Mad Day Trader, Jim Parker, on the Wednesday strategy webinar. Suffice it to say that I am now singing Waltzing Matilda in the shower every morning.
Wine Tasting in New Zealand
https://www.madhedgefundtrader.com/wp-content/uploads/2014/02/John-Thomas.jpg395271Mad Hedge Fund Traderhttps://madhedgefundtrader.com/wp-content/uploads/2019/05/cropped-mad-hedge-logo-transparent-192x192_f9578834168ba24df3eb53916a12c882.pngMad Hedge Fund Trader2014-02-25 09:22:032014-02-25 09:22:03I?m Back from the Land Down Under
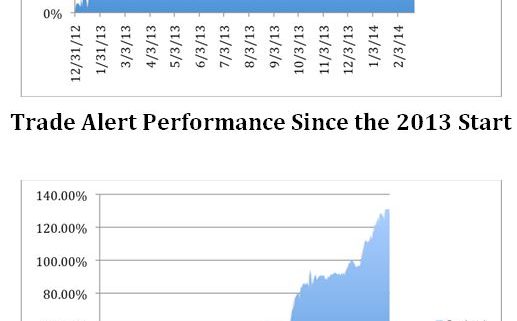
The red hot performance of the Mad Hedge Fund Trader?s Trade Alert Service has maintained its blistering pace from last year, picking up another 9.31% profit in the first seven trading weeks of 2014.
The Dow Average was down 2.3% during the same period, pegging my outperformance of the index at a stunning 11.6%. Since the beginning of 2013, I am up 76.8%. 2013 closed with a total return for followers of 67.45%.
The three-year return is now an eye popping 131.8%, compared to a far more modest increase for the Dow Average during the same period of only 36%. That brings my averaged annualized return up to 41.7%.
This has been the profit since my groundbreaking trade mentoring service was launched in 2010. It all is a matter of the harder I work, the luckier I get.
The hot streak continues.
The smartest thing I did in the past year was to let all of my options expire on January 15, and then moved to an 80% cash position. That spared me the angst, the soul searching, and the sleepless night caused by the 10% correction that followed in the Dow Average.
This set me up to cherry pick the most extreme market moves. But this time was different. Instead of returning to call spreads, I adopted an outright put option strategy.
This paved the way for me to pick up highly leveraged short positions in Treasury bonds and natural gas, while risking only 5% of my capital with each. Don?t people know that polar vortexes only come in pairs? I guess no one studies physics anymore. When the markets broke, a sharp rise in volatility also contributed to the P&L.
My esteemed colleague, Mad Day Trader Jim Parker, was no small part of this success. Since the market became technically and momentum driven, I have been confirming with him before sending out every Trade Alert. Together, out success rate is 100%.
What would you expect with a combined 85 years of market experience between the two of us? Followers are laughing all the way to the bank.
Don?t forget that Jim clocked an amazing 2013 of a staggering 374%. That is just for an eight-month year! Followers are laughing all the way to the bank.
The coming year promises to deliver a harvest of new trading opportunities. The big driver will be a global synchronized recovery that promises to drive markets into the stratosphere in 2014.
The Trade Alerts should be coming hot and heavy. Please join me on the gravy train. You will never get a better chance than this to make money for your personal account.
Global Trading Dispatch, my highly innovative and successful trade-mentoring program, earned a net return for readers of 40.17% in 2011, 14.87% in 2012, and 67.45% in 2013.
The service includes my?Trade Alert Service?and my daily newsletter, the Diary of a Mad Hedge Fund Trader. You also get a real-time trading portfolio, an enormous trading idea database, and live biweekly strategy webinars.? Upgrade to?Mad Hedge Fund Trader PRO?and you will also receive Jim Parker?s?Mad Day Trader?service.
To subscribe, please go to my website at www.madhedgefundtrader.com, find the ?Global Trading Dispatch? box on the right, and click on the blue ?SUBSCRIBE NOW? button.
https://www.madhedgefundtrader.com/wp-content/uploads/2014/02/Trade-Performance.jpg710517Mad Hedge Fund Traderhttps://madhedgefundtrader.com/wp-content/uploads/2019/05/cropped-mad-hedge-logo-transparent-192x192_f9578834168ba24df3eb53916a12c882.pngMad Hedge Fund Trader2014-02-25 09:15:102014-02-25 09:15:10Mad Hedge Fund Trader Leaps Ahead With a 9.31% 2014 Profit
In case you missed it, the second hand animal market has crashed. Forced to slash budgets by cash starved municipalities, the nation?s public zoos have been paring back their collections of living exhibits.
The Washington Zoo is trying to offload a 7,000 pound hippopotamus; while the San Francisco Zoo is short some tigers after one ate a visitor and had to be shot. The Portland Zoo was able to liquidate a portfolio of lemurs only because of the popularity of the recent DreamWorks? ?Madagascar 3? animated film.
When zoos are forced to economize, they downsize the big eaters first to save on feed costs; hence, the absence of elephants in San Francisco (Could this be a political gesture?). In fact, zoo staff were recently busted for illegally harvesting acacia on private property, a favorite food of giraffes, which grows wild here after its introduction a century ago.
The hardest to move? Baltimore has been trying to sell its snake collection for two years now. Talk about an illiquid market. Maybe they should try AIG. Snake derivatives anyone?
Pink Slips for Tony?
https://www.madhedgefundtrader.com/wp-content/uploads/2012/04/siberian-tiger-6.jpg400315Mad Hedge Fund Traderhttps://madhedgefundtrader.com/wp-content/uploads/2019/05/cropped-mad-hedge-logo-transparent-192x192_f9578834168ba24df3eb53916a12c882.pngMad Hedge Fund Trader2014-02-25 09:08:242014-02-25 09:08:24Budget Cuts Hit the Wild Animal Market
Featured Trade: (FRIDAY APRIL 25 SAN FRANCISCO STRATEGY LUNCHEON), (THINGS ARE HEATING UP IN MEXICO), (BSMX), (EWW), (UMX), (AN AFTERNOON WITH BOONE PICKENS) (UNG), (USO)
Grupo Financiero Santander Mexico, S.A.B. de C.V. (BSMX)
iShares MSCI Mexico Capped (EWW)
ProShares Ultra MSCI Mexico Cppd IMI (UMX)
United States Natural Gas (UNG)
United States Oil (USO)
https://madhedgefundtrader.com/wp-content/uploads/2019/05/cropped-mad-hedge-logo-transparent-192x192_f9578834168ba24df3eb53916a12c882.png00Mad Hedge Fund Traderhttps://madhedgefundtrader.com/wp-content/uploads/2019/05/cropped-mad-hedge-logo-transparent-192x192_f9578834168ba24df3eb53916a12c882.pngMad Hedge Fund Trader2014-02-24 01:06:032014-02-24 01:06:03February 24, 2014
I have fond memories traveling around northern Mexico during the 1950?s. My grandfather used to drive us across the border into Baja in his pickup truck, the back loaded with camping equipment, water, fishing poles, rifles, and shotguns. There was no border control.
To eat, we only had to wait for the tide to go out on the Sea of Cortez, uncovering a banquet of fresh mussels, oysters, and abalone. Eventually, my Spanish got pretty good, especially when it came to fixing cars. When we encountered rare collections of palm frond huts we would lounge around on the beach eating all the tacos we wanted for 5 cents each.
There wasn?t a hotel on the entire peninsula; and the desert was frequented with armed banditos. If any stranger approached, we fired a shot over their heads, at a considerable distance, to convince them to seek easier pickings elsewhere. It was still the Wild West down there, and we didn?t go there to socialize. As much I loved the land of Montezuma and Pancho Villa, I have never invested a penny in the country. Oil has been the bread and butter for the land south of the border for nearly a century, accounting for the largest share of the government?s revenues. But its main Cantarell field is nearly tapped out, suffering from declining production for years.
There was a decade long drug war in which 40,000 died. It seemed, for a while, that the narco terrorists would win. Mexico City became the kidnapping capital of the world. In the emerging market space, there always seemed to be better opportunities elsewhere. On top of that, the country has a long history of expropriating the property of gringos. So for decades I limited my interest in Mexico to beer, tequila, and tacos.
However, in recent months, the jungle telegraph in the hedge fund community has been buzzing about this once unloved country. I thought I?d take a closer look. It turns out that a few things have changed over the last 60 years.
First, oil. Yes, Cantarell is just about done. But much of Mexico?s subterranean geology is similar to that of the US. That means that the fracking boom, whereby untold quantities of cheap natural gas have suddenly become available, is spilling over into Mexico as well. It helps a lot that Mexico is allowing foreign investment in the industry for the first time in 70 years.
And guess what? They don?t face the environmental backlash or the permitting restrictions that American drillers must endure. As a result, Mexican energy production is taking off once again, with exports to Asia a major target. Energy infrastructure investment will become a significant economic driver in the decades to come. This is hugely positive for both the Mexican economy and the peso.
When China first burst on the international scene during the early nineties, using its cheap labor to replace much of the world?s manufacturing capacity, it was Mexico that took the big hit. Much of their low-end production, such as in textiles, decamped for the Middle Kingdom, leaving hundreds of thousands jobless.
The new ?onshoring? trend that is creating a blue-collar jobs renaissance in the US is gaining speed in Mexico too. While Chinese wages have been skyrocketing at a 20% annual rate, they have been relatively stable in Mexico.
You see this first and foremost with goods that pose logistical challenges, such as anything involving significant transportation costs. You probably don?t know this, but that big screen high definition TV dominating your living room, which used to be assembled near Shenzhen, is now put together a couple of miles inside the Mexican border with Texas. From there, they can be easily and cheaply shipped by rail or truck to any point in the US.
Mexico?s $1.18 trillion GDP ranked 14th in the world in 2012. It stood 11th in population with 112 million. Its per capita income of $10,247 comes in at 66th. The energy boom is likely to boost economic growth from the current 4% annual rate. A strong peso should cause its inflation rate to fall from the present 3.6%. I don?t have to tell you that this is a dream come true scenario for investors. Many analysts expect Mexico to join the world?s top ten economies by 2020.
The one problem Mexico has is that it is tarred with the emerging market brush (EEM), the world?s poorest performing asset classes this year. You may have to wait for the Chinese tide to lift all boats for this unloved sector to move back into the spotlight. That said, emerging markets could be the great rotation play sometime in 2014.
There are a number of American Depository Receipts (ADR?s) issued by Mexican multinationals listed on the NYSE, such as those for Grupo Financiero Santander (BSMX), one of the country?s largest banks.
If you are really brave, you can open a peso denominated account with a broker in Mexico City and invest in stocks there directly. The easiest way to put money into the country is through the Mexico iShares ETF (EWW). Or you can trade the leveraged long ETF, the ProShares Ultra MSCI Mexico Investable Market ETF (UMX).
I went down to Cabo San Lucas a few years ago for some Marlin fishing and to see what had changed. A ten-mile string of hotels lined the beach with names like the Trump Tower and the Four Seasons. The price of tacos had risen from 5 cents to $2. Free spending European tourists crowded bars like the Cabo Wabo, where they strung you up by your feet to see if you could drink tequila shots upside down.
Rather than dine at one of the many overpriced and crowded restaurants, I got in the car and drove north. I stopped at a small out of the way cove, and as the tide went out, I ate my fill of shellfish. Grandpa would have been proud.
US Dollar to the Mexican
Gotta Love Those Mexican Shares
https://www.madhedgefundtrader.com/wp-content/uploads/2013/04/Mexican.jpg244344Mad Hedge Fund Traderhttps://madhedgefundtrader.com/wp-content/uploads/2019/05/cropped-mad-hedge-logo-transparent-192x192_f9578834168ba24df3eb53916a12c882.pngMad Hedge Fund Trader2014-02-24 01:04:222014-02-24 01:04:22Things are Heating Up in Mexico
When I was remodeling my 160-year-old London house, the chimney was in desperate need of attention. After the bricklayer crawled up the fireplace, he found a yellowed and somewhat singed envelope addressed to Santa Claus.
Thinking it was placed there by my kids, he handed it over to me. In it was a letter dated Christmas, 1910 asking for a Red Indian suit.
Europeans have long had a fascination with our Native Americans. So in preparation for my upcoming European strategy luncheon tour I thought I would get myself up to date about out earliest North American residents.
Business is booming on Indian reservations these days, or it isn?t, depending on where they live. Of the country?s 565 reservations, some 239 have moved into the casino business and the cash flow has followed.
In 2010, Indian gaming reaped some $26.7 billion in revenues, or some $9,275 per indigenous native. That is a stunning 44% of America?s total casino revenues.
Some, like the Pequot tribe?s massive Foxwood operation just two hours from New York City, now the world?s largest casino, once had money raining down upon it. But the casino grew so large that it entirely occupied the diminutive Connecticut reservation allocated to it by an obscure 17th century treaty.
During the salad days, the profits were so enormous that an annual $250,000 stipend was paid to each officially registered tribal member. A poker boom helped. No surprise that the tribe grew from 167 to 665 members during the last 30 years. Today, the operation is burdened with $2.5 billion in debt, thanks to some bad investments and an ill-timed expansion.
Casinos in more rural locations in the far west, distant from population centers, have fared less well. Those that contracted out for professional management from Las Vegas and Atlantic City firms, like Harrah?s, MGM, and Caesars, earn a modest living.
But the reservations attempting local management on their own fall victim to inefficiencies, incompetence, corruption, over hiring of locals, and outright theft. Believe it or not, it is possible to lose money in the casino business, and some have had to shut down.
Overbuilding is another problem. In Northern New Mexico you can find several casinos within five miles of each other competing for the same customer. Most of their clients (real losers) are in fact local tribal members, the same individuals these houses are intended to help.
The 326 tribes that avoided the casino industry do so at the cost of a big hit to their standard of living. That explains why Native American median household income reaches only $35,062, compared to $50,046 for the US as a whole. Many, like the numerous Hopi, shun it because of their religion.
Without gambling there are few economic opportunities on the reservations. The parched conditions of the west limit farming. Unemployment runs as high as 80% on some reservations, such as the White Mountain Apaches.
As a result, a high proportion of the country?s 2.9 million Native Americans are wards of the federal government, living on food stamps and other government handouts.
That?s not how it was supposed to be. The first modern reservation was set up for the Navajo tribe in 1851 at a baking hellhole on the Pecos River, with the intention of enforcing a primitive form of apartheid to insure their survival. Today, they are the most populous tribe, with 160,000, owning the largest reservation, at 24,000 square miles, mostly in Arizona.
Those who signed treaties early survived, which gave them status as an independent nation but ceded all matters regarding defense to the federal government. In fact the Iroquois, Sioux, and the Chippewa separately declared war on Germany during WWII. Some even issue their own passports. Those that didn?t had to settle for much smaller reservations, or got wiped out.
In 1975, congress passed the Indian Self-Determination Act, which devolved power from the government to the tribes. Florida?s Seminole tribe won the right to open a casino in court in 1981, which was confirmed by the Supreme Court in 1987. After that, it was off to the races, with Indian bingo parlors sprouting across the country.
During the 19th century Indian wars when hundreds of thousands died, the practice was to attack a wagon train, kill all the men, marry the women, and adopt the children. As a result, I am descended from three different tribes, the Delaware, Sioux, and the Cherokee, as are about a quarter of native Californians my age. So I tried to cash in on government largess by applying for tribal scholarships to go to college.
It was to no avail. Only those who can trace their lineage to a 1941 Bureau of Indian Affairs census and are one eighth Native American can qualify. When whites married Indians 150 years ago, the common practice was to baptize them and give western names, obliterating their true heritage.
They were also pretty casual with marriage records in the Wild West. But we still have many of the wedding photos and know who they are.
I never did find out if that little boy got his Red Indian suit for Christmas, but I hope he did.
So, Should I Double Down?
https://www.madhedgefundtrader.com/wp-content/uploads/2012/08/indian.jpg229321Mad Hedge Fund Traderhttps://madhedgefundtrader.com/wp-content/uploads/2019/05/cropped-mad-hedge-logo-transparent-192x192_f9578834168ba24df3eb53916a12c882.pngMad Hedge Fund Trader2014-02-21 01:04:162014-02-21 01:04:16America?s Native Indian Economy
When anyone starts lecturing you that the US has the highest tax rate in the industrialized world, just turn around, walk away, and pretend you never heard of them. This person is either ignorant about this country's taxation system, or is deliberately trying to deceive you.
According to a report released by the Internal Revenue Service, America's tax collection agency, the top 400 individual tax returns filed in 2009 reported an average gross income of $358 million each. The average amount of tax paid by these individuals came to under 17%, less than half the maximum Federal rate of 39%, which kicks in on annual income over $372,950 (click here for the 2012 tax tables).
This explains why Warren Buffet pays a much lower tax rate than his secretary. It really is true that in America, only the poor people pay taxes.
Look at any international comparison of taxes to GDP, and one can always find the United States at the bottom of the table. A Low American tax is one of the main reasons why I moved my company here from England 20 years ago.
Take a look at the Fortune 500, where one third of the largest companies pay no tax at all, and many that dominate the top of the list, like the oil majors and technology companies, pay only token amounts. However, if any politician wants to pander to voters during election time on a tax-cutting platform he will only bluster on about ?high tax rates?, not actual taxes paid.
What the US has that other countries lack is the 77,000 pages of the Internal Revenue Code. It is a 100 year accumulation of deductions, accelerated depreciation rates, tax credits, and other tax breaks that are the end product of intensive lobbying efforts and bribes by special interest groups, corporations, unions, and even religious groups.
If you do have a big tax bill, you need to hire a new accountant.
Take a look at the oil industry again. The oil depletion allowance permits drillers to deduct a substantial portion of the cost of a new well in the first year (click here for its fascinating history). When I first got into the oil and gas business 15 years ago, after reading the relevant sections of the tax code, I couldn't understand why everyone wasn't drilling for Texas tea.
The total value of this one tax break to the industry is estimated at $55 billion a year. This explains why we have had three presidents from Texas in the last 50 years. Some of this money ends up in campaign donations.
I have a very simple solution to the country's budget deficit problem. Hit the reset button. Eliminate the Internal Revenue Code. Just set it on fire or send it to the recycling bin. Keep the existing progressive, hockey stick tax rates on income, but eliminate all deductions.
And I mean everything; deductions for dependents, home mortgage interest, medical expenses, the works. The oil depletion allowance other corporate loopholes are worth at least $150 billion a year in lost federal revenues. There are no sacred cows.
My revised Form 1040 would be much like the original 1913 return, a postcard that would have only five lines on it:
Name Social Security number Income Tax Rate Tax Due
The budget deficit would disappear overnight. Government spending would shrink dramatically, because you could ditch most of the 100,000 who work for the IRS. Some 1.3 million auditors, CPA's, tax attorneys, and bookkeepers would have to hit the road in search of new work too.
The amount of money that is wasted on tax collection in this country is truly staggering. This is not some pie in the sky concept. This is how taxation already works in most countries, and they seem to get along just fine.
In fact, the whole scheme might even pay for itself.
I Don't See Any Jobs For Former IRS Agents, Do You?
https://www.madhedgefundtrader.com/wp-content/uploads/2012/04/irs.jpg320213Mad Hedge Fund Traderhttps://madhedgefundtrader.com/wp-content/uploads/2019/05/cropped-mad-hedge-logo-transparent-192x192_f9578834168ba24df3eb53916a12c882.pngMad Hedge Fund Trader2014-02-21 01:03:372014-02-21 01:03:37The Tax Rate Fallacy
To the dozens of subscribers in Iraq, Afghanistan, and the surrounding ships at sea, thank you for your service!
I think it is very wise to use your free time to read my letter and learn about financial markets in preparation for an entry into the financial services when you cash out. Nobody is going to call you a baby killer and shun you, as they did when I returned from Southeast Asia four decades ago. In fact, many firms on Wall Street give veterans applications first priority, because they know they can get millions of dollars worth of training and discipline for free.
I have but one request. No more subscriptions with .mil addresses, please. The Defense Department, the CIA, the NSA, Homeland Security, and the FBI do not look kindly on newsletters entering the military network, even the investment kind. If you think civilian spam filters are tough, watch out for the military kind! And no, I promise that there are no secret messages embedded with the stock tips. ?BUY? really does mean ?BUY.?
If I did not know the higher ups at these agencies, as well as the Joints Chiefs of Staff, I might be bouncing off the walls in a cell at Guantanamo by now. It also helps that many of the mid level officers at these organizations have made a fortune with their meager government retirement funds following my advice. All I can say is that if the Baghdad Stock Exchange ever become liquid, I?m going to own it.
Where would you guess the greatest concentration of readers The Diary of a Mad Hedge Fund Trader is found? New York? Nope. London? Wrong. Chicago? Not even close. Try a ten mile radius centered on Langley, Virginia, by a large margin. The funny thing is, half of the subscribing names coming in are Russian. I haven?t quite figured that one out yet.
So keep up the good work, and fight the good fight. But please, only subscribe to my letter with personal Gmail or hotmail addresses. That way my life can become a lot more boring. Oh, and by the way, Langley, you?re behind on you bill. Please pay up, pronto, and I don?t want to hear whining about any damn budget cuts!
Semper Fidelis!
I Want My Mad Hedge Fund Trader!
https://www.madhedgefundtrader.com/wp-content/uploads/2013/02/Soldier-e1403118645688.jpg227319Mad Hedge Fund Traderhttps://madhedgefundtrader.com/wp-content/uploads/2019/05/cropped-mad-hedge-logo-transparent-192x192_f9578834168ba24df3eb53916a12c882.pngMad Hedge Fund Trader2014-02-20 01:05:502014-02-20 01:05:50Notice to Military Subscribers
Legal Disclaimer
There is a very high degree of risk involved in trading. Past results are not indicative of future returns. MadHedgeFundTrader.com and all individuals affiliated with this site assume no responsibilities for your trading and investment results. The indicators, strategies, columns, articles and all other features are for educational purposes only and should not be construed as investment advice. Information for futures trading observations are obtained from sources believed to be reliable, but we do not warrant its completeness or accuracy, or warrant any results from the use of the information. Your use of the trading observations is entirely at your own risk and it is your sole responsibility to evaluate the accuracy, completeness and usefulness of the information. You must assess the risk of any trade with your broker and make your own independent decisions regarding any securities mentioned herein. Affiliates of MadHedgeFundTrader.com may have a position or effect transactions in the securities described herein (or options thereon) and/or otherwise employ trading strategies that may be consistent or inconsistent with the provided strategies.