I rely on hundreds of 'moles' around the world whose job it is to watch a single, but important indicator for the world economy. One of them checks for me the want ads in the manufacturing mega city of Shenzhen, China, and what he told me last week was alarming.
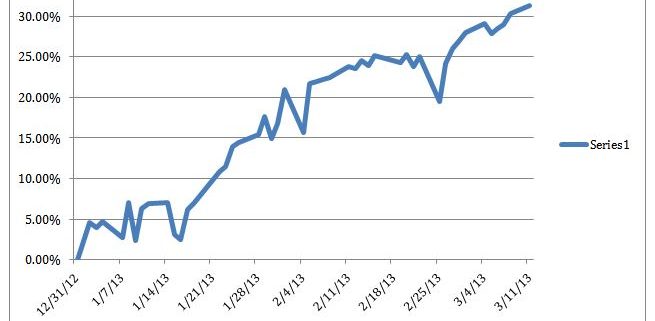
Wage demands by Chinese workers have been skyrocketing this year. The biggest increases have been at the low end of the spectrum, where migrant workers from the provinces are earning up to 40% more than a year ago. Wage settlements of 20% or more for trained workers are common. One factory that gave staff only a 10% increase saw many of them fail to return after the recent Chinese lunar New Year.
Of course China's blistering 8% GDP growth is to cause, which has pushed inflation well beyond the government's 4% target. So the cost of living in the Middle Kingdom is rising dramatically. The problem has been particularly severe with imported commodities, such as in food. Hence, the increased demands.
This is important for the rest of us because low wages have been the cornerstone of the Chinese economic miracle. In just the last decade, average monthly Chinese wages have climbed from the bottom rung to the middle tier. That seriously erodes the country's cost advantage, which has gained such enormous shares in foreign markets, like the US. Take away the country's price advantages, and demand will wither, slowing growth globally.
What will they be demanding next? Collective bargaining rights? In the meantime, keep checking those Craig's List entries for Shanghai.
Average Monthly Salary
$3,099 Yokohama, Japan
$1,220 Seoul, South Korea
$888 Taipei, Taiwan
$235 Shenzhen, China
$148 Jakarta, Indonesia
$100 Ho Chi Minh City, Vietnam
$47 Dhaka, Bangla Desh