I am once again writing this report from a first-class sleeping cabin on Amtrak’s legendary California Zephyr.
By day, I have two comfortable seats facing each other next to a panoramic window. At night, they fold into two bunk beds, a single and a double. There is a shower, but only Houdini could get to navigate it.
I am not Houdini, so I go downstairs to use the larger public hot showers. They are divine.

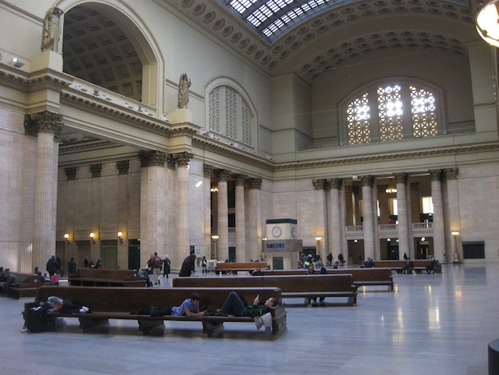
We are now pulling away from Chicago’s Union Station, leaving its hurried commuters, buskers, panhandlers, and majestic great halls behind. I love this building as a monument to American exceptionalism.
I am headed for Emeryville, California, just across the bay from San Francisco, some 2,121.6 miles away. That gives me only 56 hours to complete this report.
I tip my porter, Raymond, $100 in advance to make sure everything goes well during the long adventure and to keep me up to date with the onboard gossip.
The rolling and pitching of the car is causing my fingers to dance all over the keyboard. Microsoft’s Spellchecker can catch most of the mistakes, but not all of them.
As both broadband and cell phone coverage are unavailable along most of the route, I have to rely on frenzied Internet searches during stops at major stations along the way to Google search obscure data points and download the latest charts.
You know those cool maps in the Verizon stores that show the vast coverage of their cell phone networks? They are complete BS.
Who knew that 95% of America is off the grid? That explains so much about our country today.
I have posted many of my better photos from the trip below, although there is only so much you can do from a moving train and an iPhone 10x.
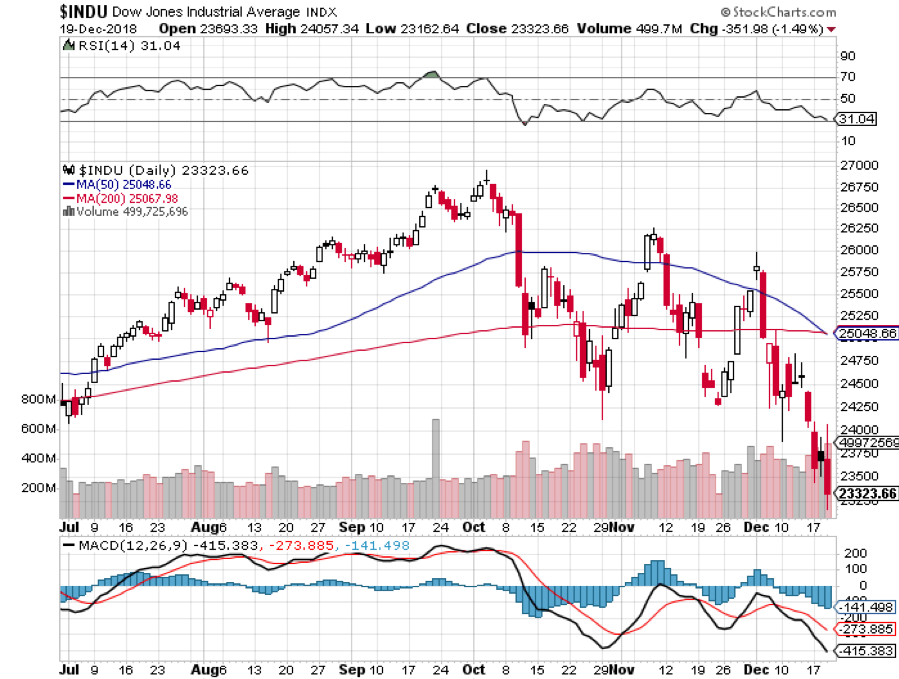
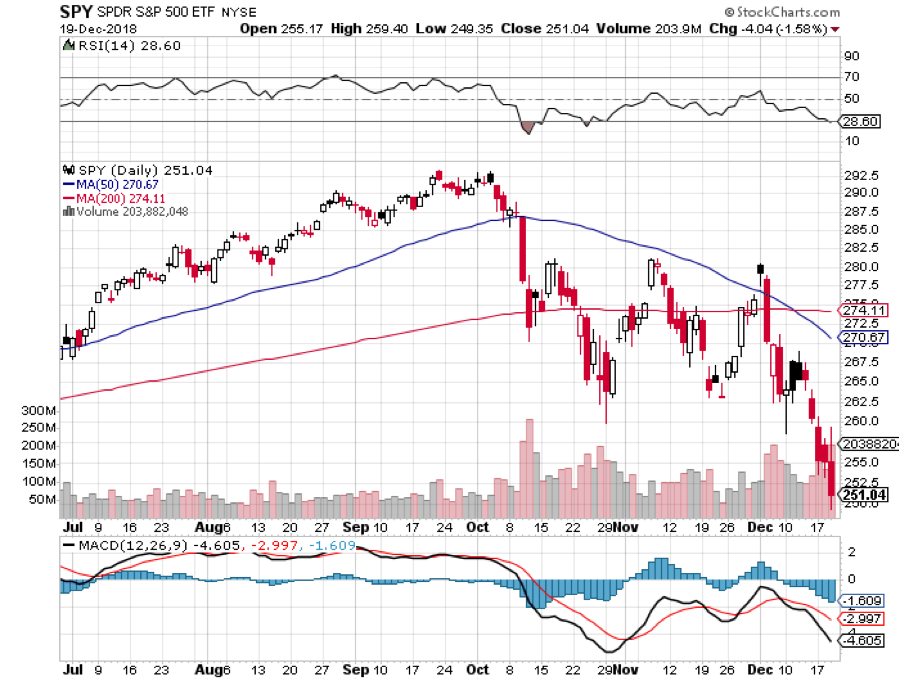
After making the rounds with strategists, portfolio managers, and hedge fund traders in the run-up to this trip, I can confirm that 2018 was one of the most brutal to trade for careers lasting 30, 40, or 50 years. This was the year that EVERYTHING went down, the first time that has happened since 1972. Comparisons with 1929, 1987, and 2008 were frequently made.
While my own 23.56% return for last year is the most modest in a decade, it beats the pants off of the Dow Average plunge of 8% and 99.9% of the other managers out there. That is a mere shadow of the spectacular 57.91% profit I took in during 2017. This keeps my ten-year average annualized return at 34.20%.
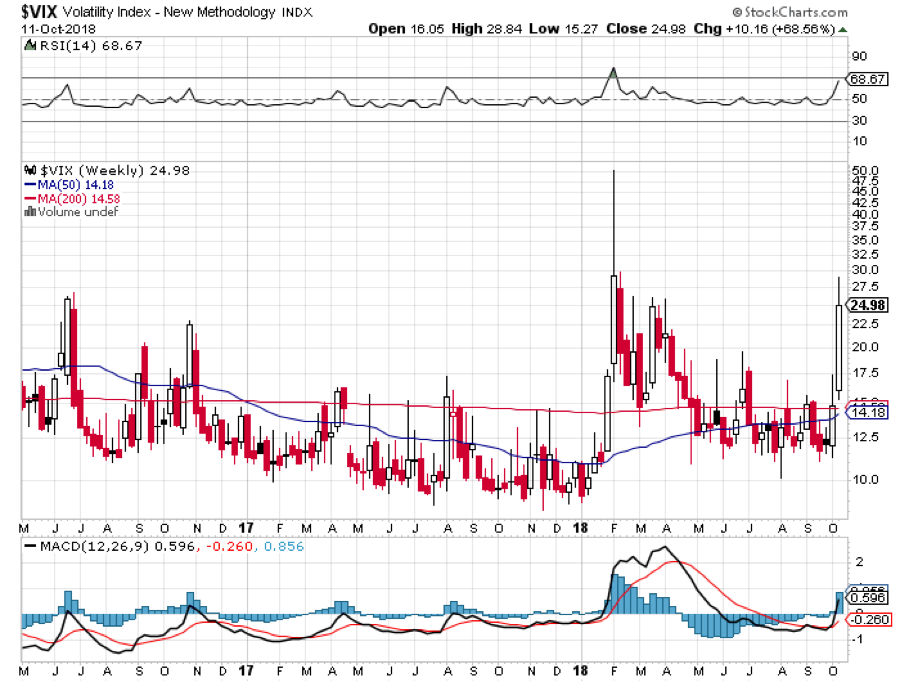
Our entire fourth-quarter loss came from a single trade, a far too early bet that the Volatility Index would fall from the high of the year at $30.
For a decade, all you had to do was throw a dart at the stock page of the Wall Street Journal and you made money, as long as it didn’t end on retail. No more.
For the first time in years, the passive index funds lost out to the better active managers. The Golden Age of the active manager is over. Most hedge funds did horribly, leveraged long technology stocks and oil and short bonds. None of it worked.
If you think I spend too much time absorbing conspiracy theories from the Internet, let me give you a list of the challenges I see financial markets facing in the coming year:

The Nine Key Variables for 2019
1) Will the Fed raise rates one, two, or three times, or not at all?
2) Will there be a recession this year or will we have to wait for 2020?
3) Is the tax bill fully priced into the economy or is there more stimulus to come?
4) Will the Middle East drag us into a new war?
5) Will technology stocks regain market leadership or will it be replaced by other sectors?
6) Will gold and other commodities finally make a long-awaited comeback?
7) Will rising interest rates (positive) or deficits (negative) drive the US dollar this year?
8) Will oil prices recover in 2019?
9) Will bitcoin ever recover?
Here are your answers to the above: 1) Two, 2) 2020, 3) Yes, 4) No, 5) Both, 6) Yes, 7) Yes, 8) Yes, 9) No.
There you go! That’s all the research you have to do for the coming year. Everything else is a piece of cake. You can go back to your vacation.

The Twelve Highlights of 2018
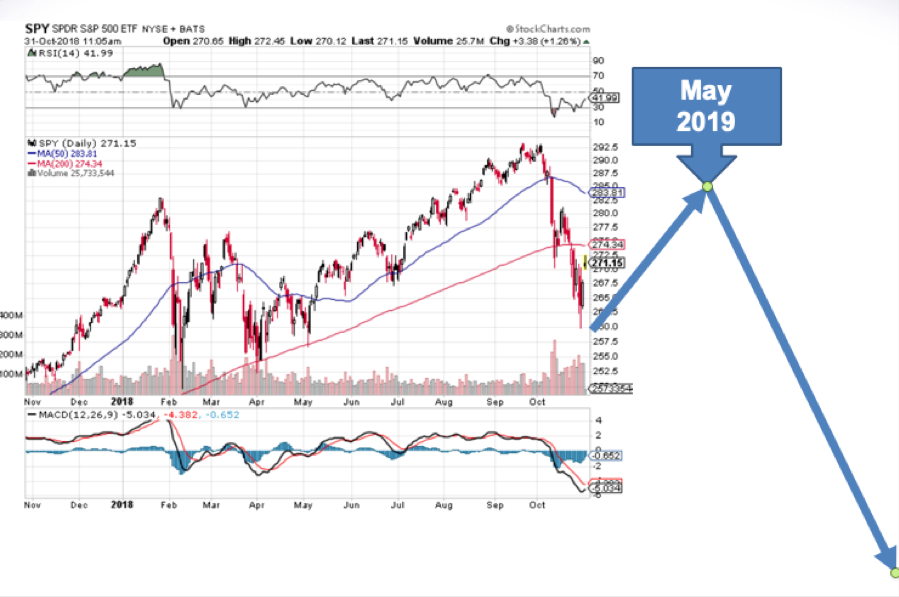
1) Stocks will finish lower in 2019. However, we aren’t going to collapse from here. We will take one more rush at the all-time highs that will take us up 10% to 15% from current levels, and then fail. That will set up the perfect “head and shoulders” top on the long-term charts that will finally bring to an end this ten-year bull market. This is when you want to sell everything. The May 10, 2019 end to the bull market forecast I made a year ago is looking pretty good.
I think there is a lot to learn from the 1987 example when stocks crashed 20% in a single day, and 42% from their 1987 high, and then rallied for 28 more months until the next S&L crisis-induced recession in 1991.
Investors have just been put through a meat grinder. From here on, its all about trying to get out at a better price, except for the longest-term investors.
2) Stocks will rally from here because they are STILL receiving the greatest amount of stimulus in history. Energy prices have dropped by half, taxes are low, inflation is non-existent, and interest rates are still well below long term averages.
Corporate earnings will grow at a 6% rate, not the 26% we saw in 2018. But growing they are. At current prices, the stock market is assuming that companies will generate big losses in 2019, which they won’t. Just try to find a parking space at a shopping mall anywhere and you’ll see what I mean.
3) Technology stocks will lead any recovery. Love them or hate them, big tech accounts for 25% of stock market capitalization but 50% of US profits. That is where the money is. However, in 2019 they will be joined by biotech and health care companies as market leaders.
4) The next big rally in the market will be triggered by the end of the trade war with China. Don’t expect the US to get much out of the deal. It turns out that the Chinese can handle a 20% plunge in the stock market much better than we can.
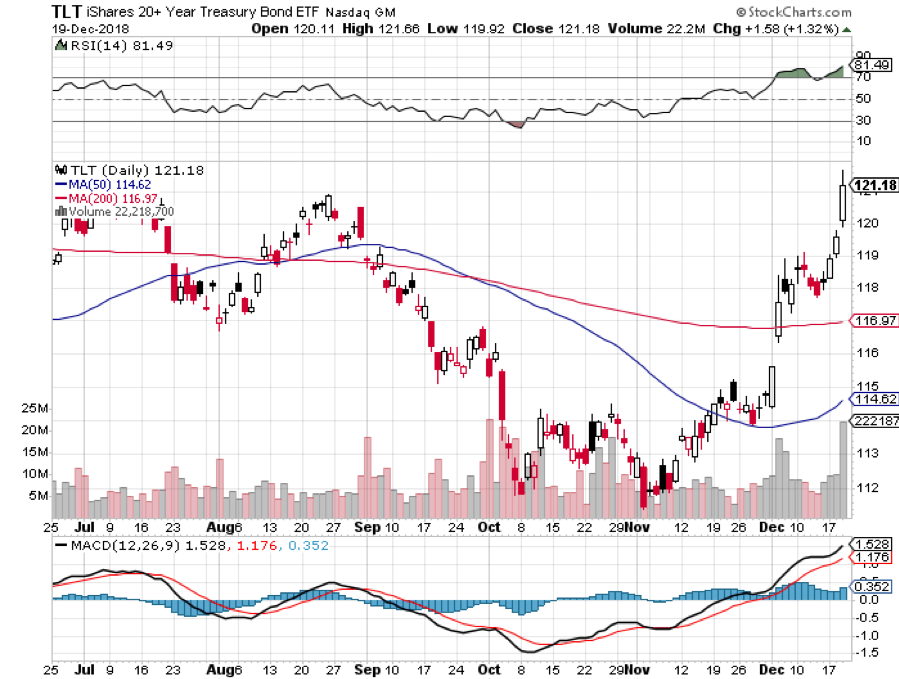
5) The Treasury bond market will finally get the next leg down in its new 10-year bear market, but don’t expect Armageddon. The ten-year Treasury yield should hit at least 3.50%, and possibly 4.0%.
6) With slowing, US interest rate rises, the US dollar will have the wind knocked out of it. It’s already begun. The Euro and the Japanese yen will both gain about 10% against the greenback.
7) Political instability is a new unknown factor in making market predictions which most of us have not had to deal with since the Watergate crisis in 1974. It’s hard to imagine the upcoming Mueller Report not generating a large market impact, and presidential tweets are already giving us Dow 1,000-point range days. These are all out of the blue and totally unpredictable.
8) Oil at $42.50 a barrel has also fully discounted a full-on recession. So, if the economic slowdown doesn’t show, we can make it back up to $64 quickly, a 50% gain.
9) Gold continues its slow-motion bull market, gaining another 10% since the August low. It barely delivered in 2018 as a bear market hedge. But once inflation starts to pick up a head of steam, so should the price of the barbarous relic.
10) Commodities had a horrific year, pulled under by the trade war, rising rates, and strong dollar. Reverse all that and they should do better.
11) Residential real estate has been in a bear market since March. You’ll find out for sure if you try to sell your home. Rising interest rates and a slowing economy are not what housing bull markets are made of. However, prices will drop only slightly, like 10%, as there is still a structural shortage of housing in the US.
12) The new tax bill came and went with barely an impact on the economy. At best we got two-quarters of above-average growth and slightly higher capital spending before it returned to a 2%-2.5% mean. Unfortunately, it will cost us $4 trillion in new government debt to achieve this. It was probably the worst value for money spent in American history.
![]() Dow Average 1987-90
Dow Average 1987-90
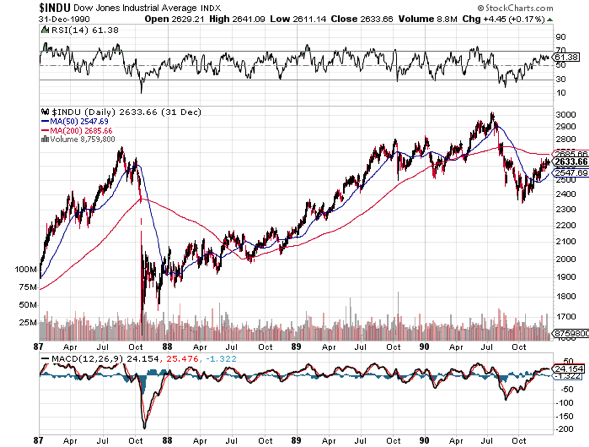 Dow Average 1987-90

The Thumbnail Portfolio
Equities - Go Long. The tenth year of the bull market takes the S&P 500 up 13% from $2,500 to $2,800 during the first half, and then down by more than that in the second half. This sets up the perfect “head and shoulders” top to the entire decade-long move that I have been talking about since the summer.
Technology, Pharmaceuticals, Healthcare, and Biotech will lead on the up moves and now is a great entry point for all of these. Buy low, sell high. Everyone talks about it but few ever actually execute like this.
Bonds - Sell Short. Down for the entire year big time. Sell short every five-point rally in the ten-year Treasury bond. Did I mention that bonds have just had a ten-point rally? That’s why I am doubled up on the short side.
Foreign Currencies - Buy. The US dollar has just ended its five-year bull trend. Any pause in the Fed’s rate rising schedule will send the buck on a swan dive, and it’s looking like we may be about to get a six-month break.
Commodities - Go Long. Global synchronized recovery continues the new bull market.
Precious Metals - Buy. Emerging market central bank demand, accelerating inflation, and a pause in interest rate rises will keep the yellow slowly rising.
Real Estate – Stand Aside. Prices are falling but not enough to make it worth selling your home and buying one back later. A multi-decade demographic tailwind is just starting, and it is just a matter of time before prices come roaring back.

1) The Economy-Slowing
A major $1.5 trillion fiscal stimulus was a terrible idea in the ninth year of an economic recovery with employment at a decade high. Nevertheless, that’s what we got.
The certainty going forward is that the gains provided by lower taxes will be entirely offset by higher interest rates, higher labor costs, and rising commodity and oil prices.
Since most of the benefits accrued to the top 1% of income earners, the proceeds of these breaks entirely ended up share buybacks and the bond market. This is why interest rates are still so incredibly low, even though the Fed has been tightening for 4 ½ years (remember the 2014 taper tantrum?) and raising rates for three years.
And every corporate management views these cuts as temporary so don’t expect any major capital investment or hiring binges based on them.
The trade wars have shifted the global economy from a synchronized recovery to a US only recovery, to a globally-showing one. It turns out that damaging the economies of your biggest economies is bad for your own business. They are also a major weight on US growth. CEOs would rather wait to see how things play out before making ANY long-term decisions.
As a result, I expect real US economic growth will retreat from the 3.0% level of 2018 to a much more modest 1.5%-2.0% range in 2019.
The government shutdown, now in its third week (and second year), will also start to impact 2019 growth estimates. For every two weeks of closure, you can subtract 0.1% in annual growth.
Twenty weeks would cut a full 1%. And if you only have 2% growth to start with that means you don’t have much to throw away until you end up in a full-on recession.
Hyper-accelerating and cross-fertilizing technology will remain a long term and underestimated positive. But you have to live here next to Silicon Valley to realize that.
S&P 500 earnings will grow from the current $170 to $180 at a price earnings multiple at the current 14X, a gain of 6%. Unfortunately, these will start to fade in the second half from the weight of rising interest rates, inflation, and political certainty. Loss of confidence will be a big influence in valuing shares in 2019.
Whatever happened to the $2.5 trillion in offshore funds held by American companies expected to be repatriated back to the US? That was supposed to be a huge market stimulus last year. It’s still sitting out there. It turns out companies still won’t bring the money home even with a lowly 10% tax rate. They’d rather keep it abroad to finance growth there or borrow against it in the US.
Here is the one big impact of the tax bill that everyone is still missing. The 57% of the home-owning population are about to find out how much their loss of local tax deductions and mortgage deductions is going to cost them when they file their 2018 returns in April. They happen to be the country’s biggest spenders. That’s another immeasurable negative for the economy.
Take money out of the pockets of the spenders and give it to the savers and you can’t have anything but a weakening on the economy.
All in all, it will be one of the worst years of the decade for the economy. Maybe that’s what the nightmarish fourth quarter crash was trying to tell us.

A Rocky Mountain Moose Family
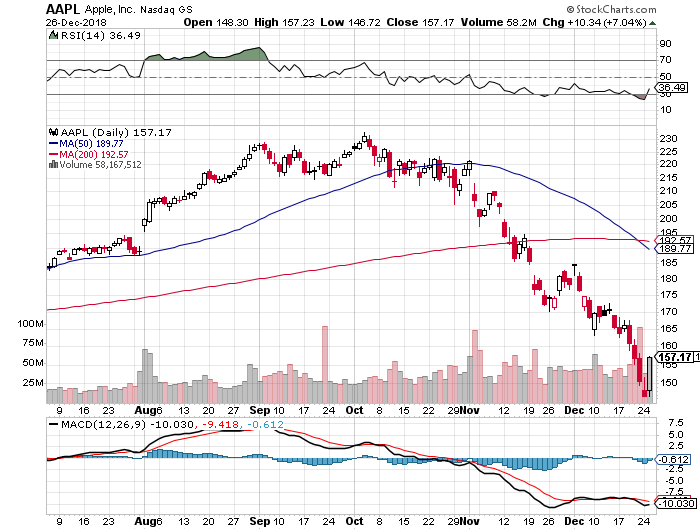
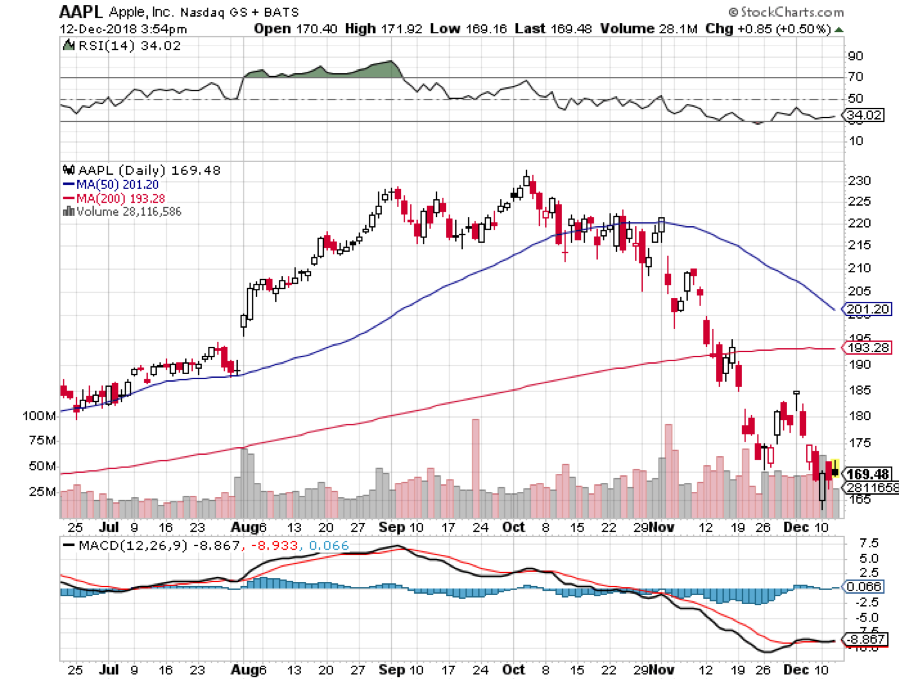
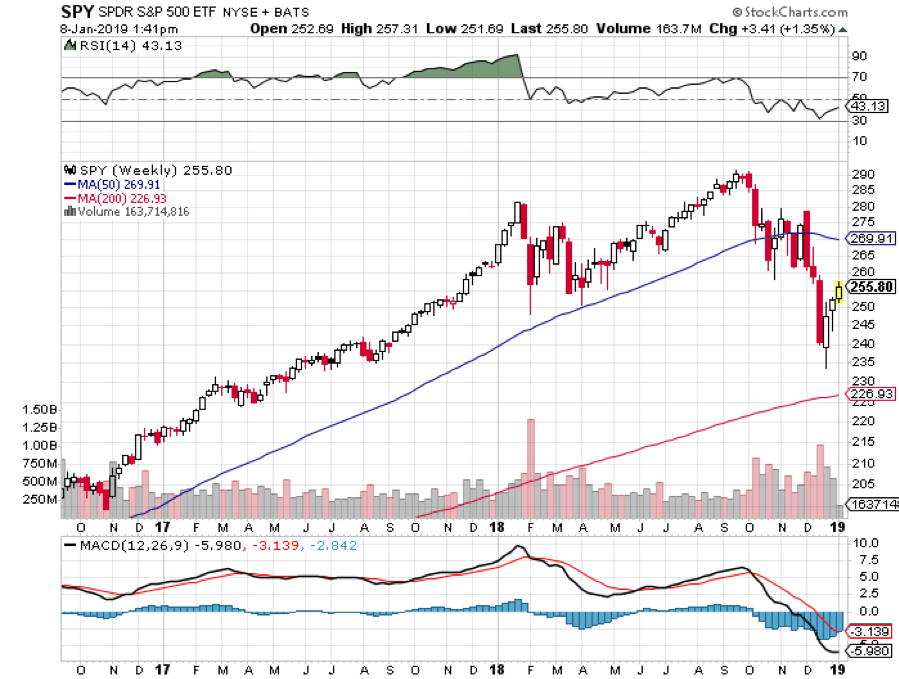
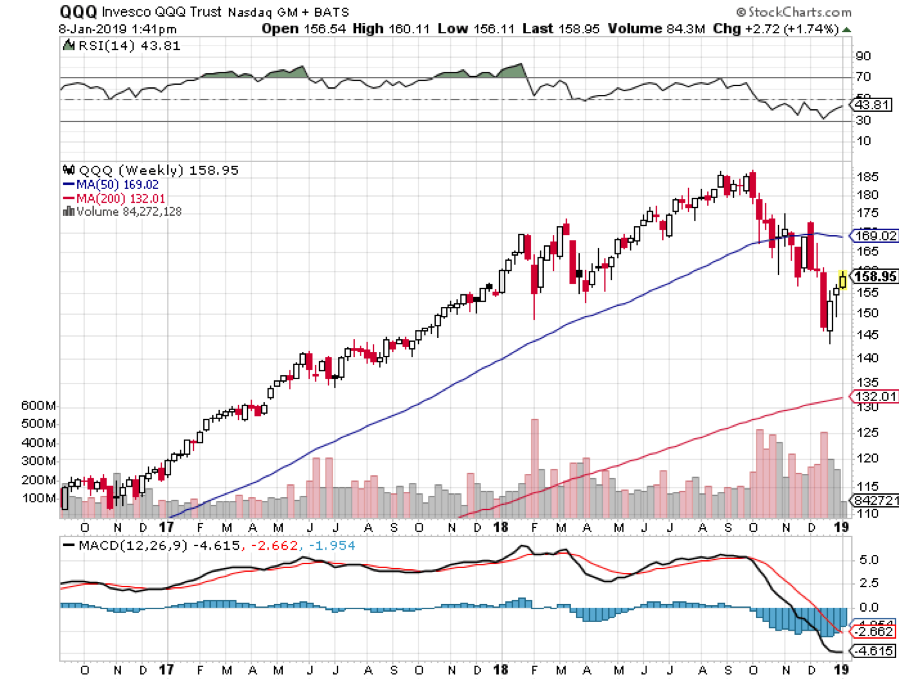
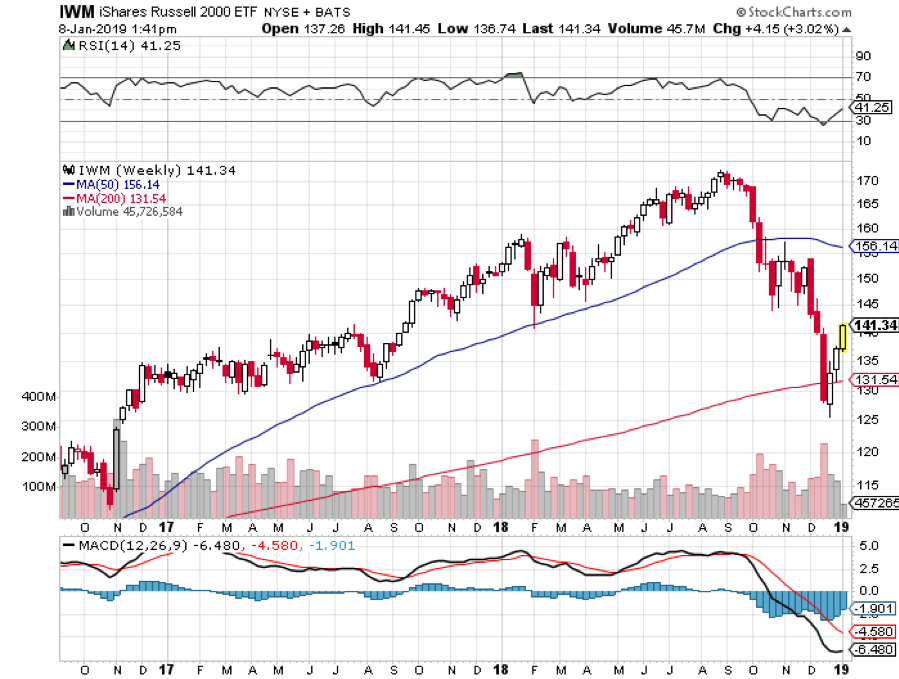
2) Equities (SPX), (QQQ), (IWM) (AAPL), (XLF), (BAC)
The final move of a decade long bull market is upon us.
Corporate earnings are at record levels and are climbing at 6% a year. Cash on the balance sheet is at an all-time high as are profit margins. Interest rates are still near historic lows.
Yet, there is not a whiff of inflation anywhere except in now fading home costs and paper asset prices. Almost all other asset classes offer pitiful alternatives.
The golden age of passive index investing is over. This year, portfolio managers are going to have to earn their crust of bread through perfect market timing, sector selection, and individual name-picking. Good luck with that. But then, that’s why you read this newsletter.
I expect an inverse “V”, or Greek lambda type of year. Stocks will rally first, driven by delayed rate rises, a China war settlement, and the end of the government shut down. That will give the Fed the confidence to start raising rates again by mid-year because inflation is finally starting to show. This will deliver another gut-punching market selloff in the second half giving us a negative stock market return for the second year in a row. That hasn’t happened since the Dotcom Bust of 2001-2002.
How much money will I make this year? A lot more than last year’s middling 23.56% because now we have some reliable short selling opportunities for the first time in a decade. Short positions performed dreadfully when global liquidity is expanding. They do much better when it is shrinking, as it is now.
![]() Frozen Headwaters of the Colorado River
Frozen Headwaters of the Colorado River
 Frozen Headwaters of the Colorado River
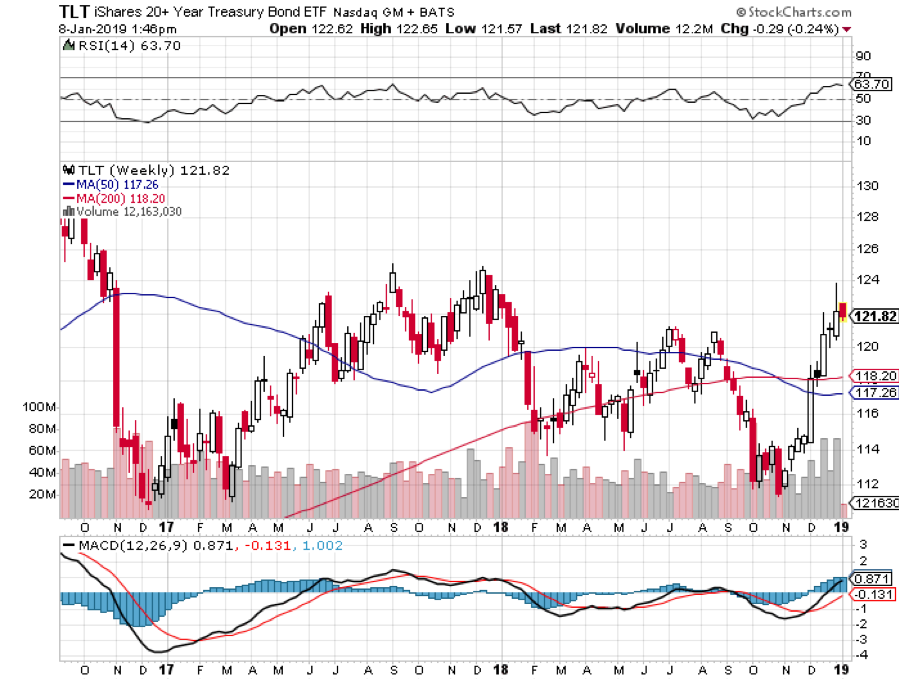
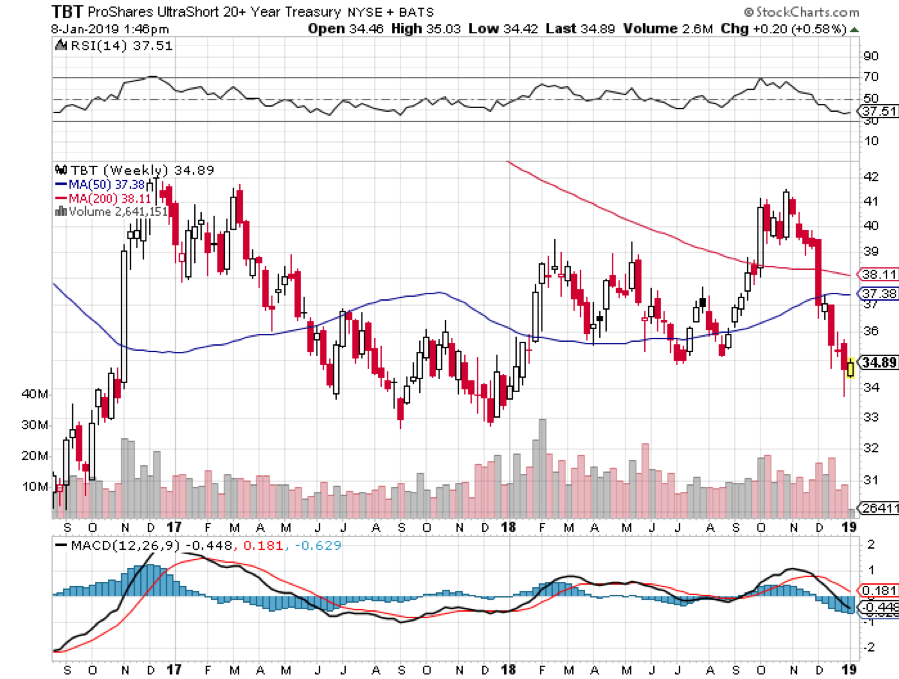
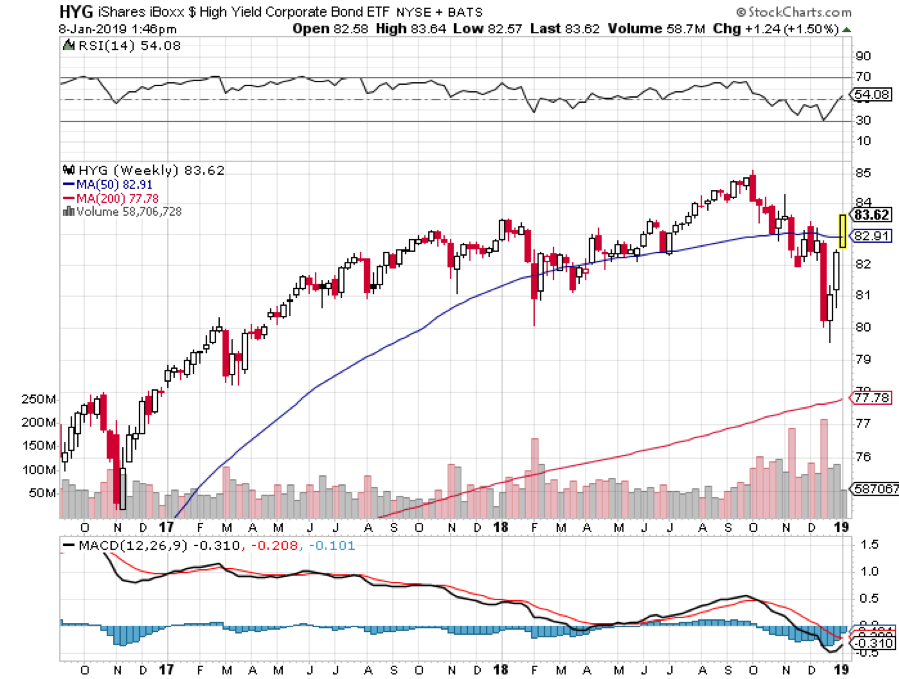
3) Bonds (TLT), (TBT), (JNK), (PHB), (HYG), (MUB), (LQD)
Amtrak needs to fill every seat in the dining car to get everyone fed, so you never know who you will share a table with for breakfast, lunch, and dinner.
There was the Vietnam vet Phantom jet pilot who now refused to fly because he was treated so badly at airports. A young couple desperate fleeing Omaha could only afford seats as far as Salt Lake City, sitting up all night. I paid for their breakfast.
A retired British couple was circumnavigating the entire US in a month on a “See America Pass.” Mennonites returning home by train because their religion forbade automobiles or airplanes.
This year is simply a numbers game for the bond market. The budget deficit should come in at a record $1.2 trillion. The Fed will take out another $600 billion through quantitative tightening. Some $1.8 trillion will be far too much for the bond market to soak up, meaning prices can only fall.
Except that this year is different for the following reasons.
1) The US government is now at war with the world’s largest bond buyer, the Chinese government.
2) A declining US dollar will frighten off foreign buyers to a large degree.
3) The tax cuts have come and gone with no real net benefit to the average American. Probably half of the country saw an actual tax increase from this tax cut, especially me.
All are HUGELY bond negative.
It all adds up to a massive crowding out of individual and corporate borrowers by the federal government, which will be forced to bid up for funds. You are already seeing this in exploding credit spreads. This will be a global problem. There are going to be a heck of a lot of government bonds out there for sale.
That 2.54% yield for the ten-year Treasury bond you saw on your screen in early January? You will laugh at that figure in a year as it hits 3.50% to 4.0%.
Bond investors today get an unbelievably bad deal. If they hang on to the longer maturities, they will get back only 90 cents worth of purchasing power at maturity for every dollar they invest a decade down the road at best.
The only short-term positive for bonds was Fed governor Jay Powell’s statement last week that our central bank will be sensitive to the level of the stock market when considering rate rises. That translates into the reality that rates won’t go up AT ALL as long as markets are in crash mode.
It all means that we are now only two and a half years into a bear market that could last for ten or twenty years.
The IShares 20+ Year Treasury Bond ETF (TLT) trading today at $123 could drop below $100. The 2X ProShares 20+ Short Treasury Bond Fund (TBT) now at $31 is headed for $50 or more.
Junk Bonds (HYG) are already reading the writing on the wall taking a shellacking during the Q4 stock market meltdown. This lackluster return ALWAYS presages an inverted yield curve by a year where short term interest rates are higher than long term ones. This in turn reliably predicts a full-scale recession by 2020 at the latest.

A Visit to the 19th Century
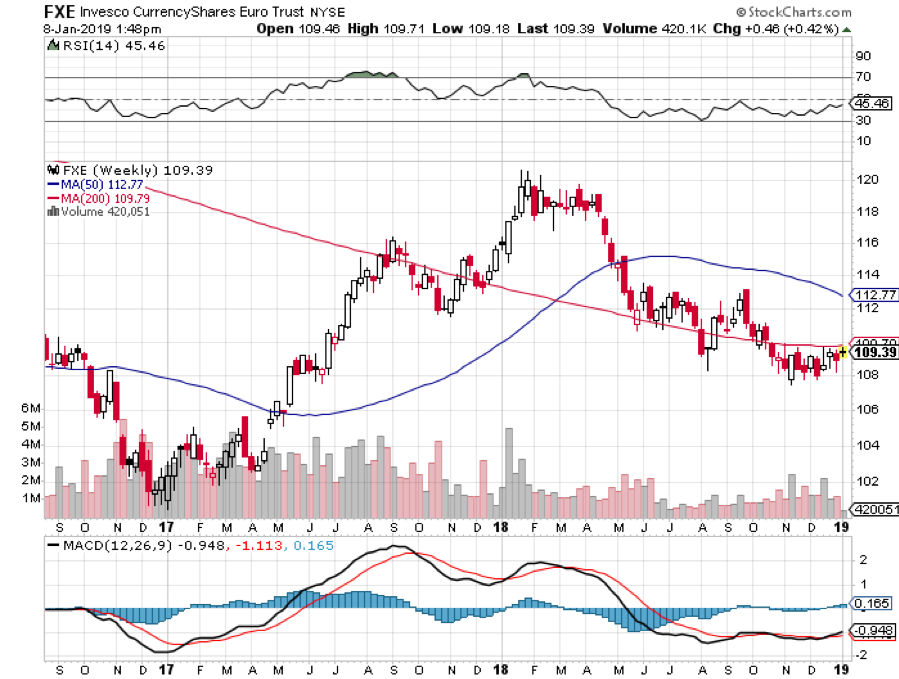
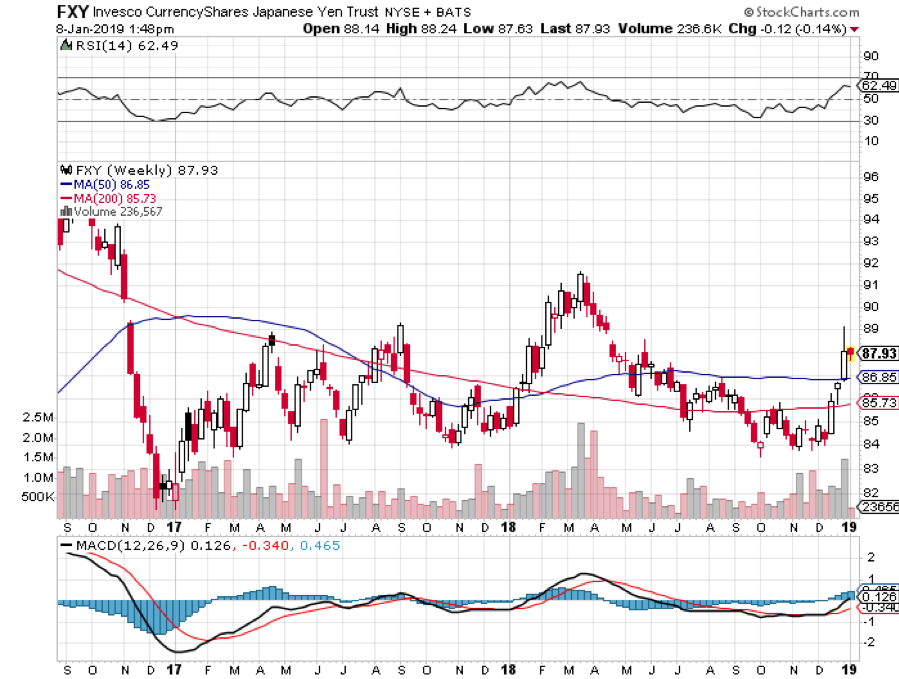
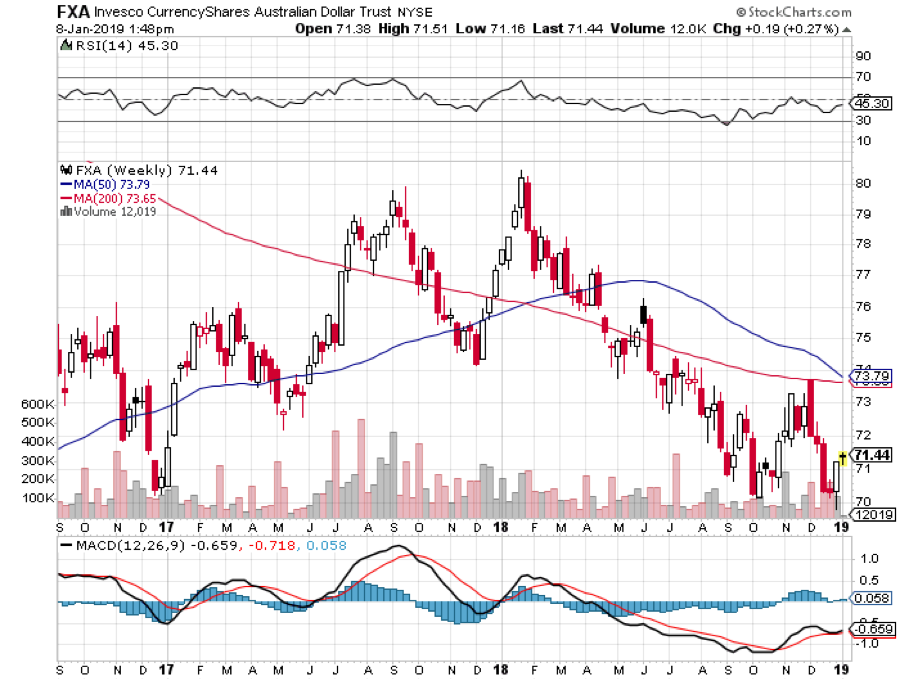
4) Foreign Currencies (FXE), (EUO), (FXC), (FXA), (YCS), (FXY), (CYB)
I have pounded away at you for years that interest rate differentials are far and away the biggest decider of the direction in currencies.
This year will prove that concept once again.
With overnight rates now at 2.50% and ten-year Treasury bonds at 2.54%, the US now has the highest interest rates of any major industrialized economy.
However, pause interest rate rises for six months or a year and the dollar loses its mojo very quickly.
Compounding the problem is that a weak dollar begets selling from foreign investors. They are in a mood to do so anyway, as they see rising political instability in the US a burgeoning threat to the value of the greenback.
So the dollar will turn weak against all major currencies, especially the Japanese yen (FXY), and the Australian (FXA) and Canadian (FXC) dollars.
You can take that to the bank.

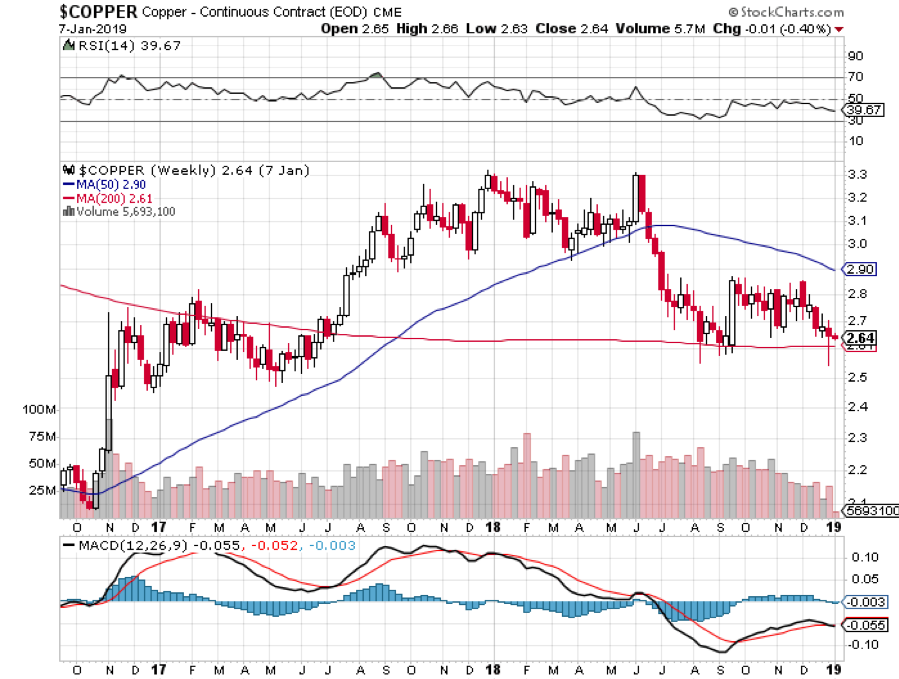
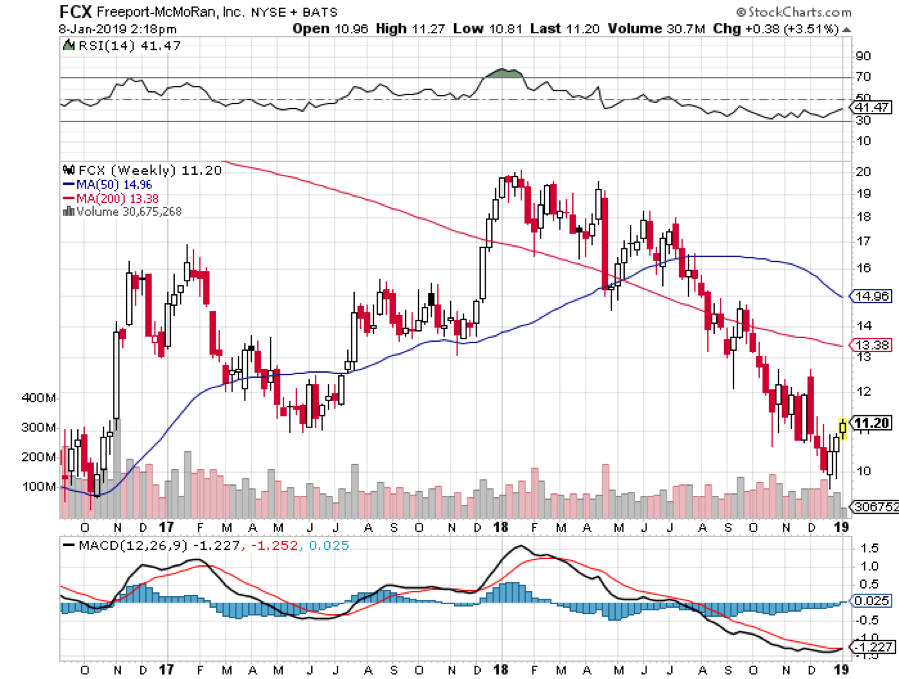
5) Commodities (FCX), (VALE), (MOO), (DBA), (MOS), (MON), (AGU), (POT), (PHO), (FIW), (CORN), (WEAT), (SOYB), (JJG)
A global synchronized economic slowdown can mean only one thing and that is sustainably lower commodity prices.
Industrial commodities, like copper, iron ore, performed abysmally in 2018, dope slapped by the twin evils of a strong dollar and the China trade war.
We aren’t returning to the heady days of the last commodity bubble top anytime soon. Investors are already front running that move now.
However, once this sector gets the whiff of a weak dollar or higher inflation, it will take off like a scalded chimp.
Now that their infrastructure is largely built out, the Middle Kingdom will change drivers of its economy. This is world-changing.
The shift will be from foreign exports to domestic consumption. This will be a multi-decade process, and they have $3.1 trillion in foreign exchange reserves to finance it.
It will still demand prodigious amounts of imported commodities but not as much as in the past.
This trend ran head-on into a decade-long expansion of capacity by the commodities industry, delivering the five-year bear market that we are only just crawling out of.
The derivative equity plays here, Freeport McMoRan (FCX) and Companhia Vale do Rio Doce (VALE) have all been some of the best-performing assets of 2017.

Snow Angel on the Continental Divide
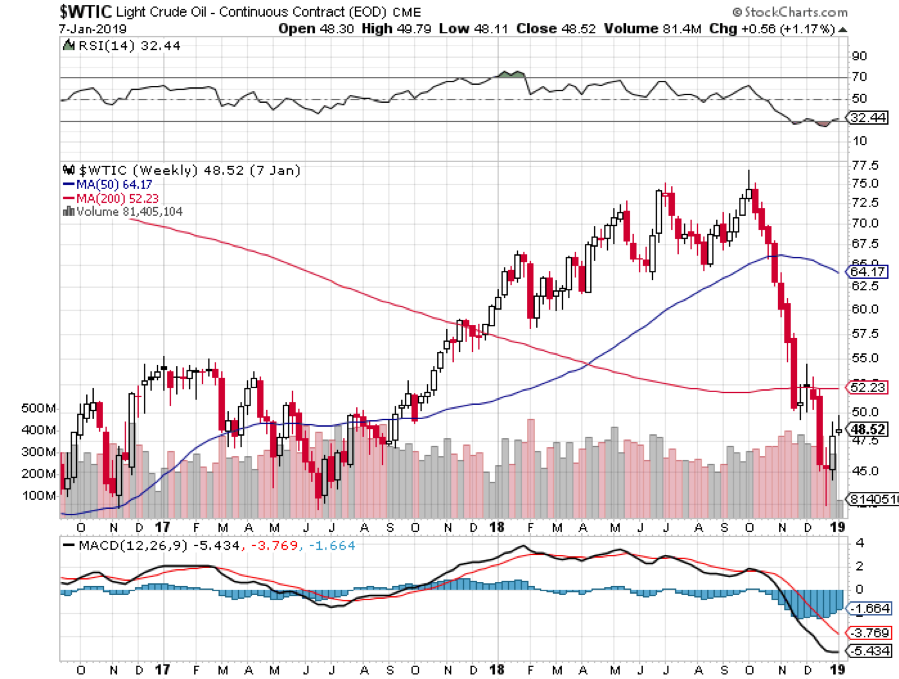
6) Energy (DIG), (RIG), (USO), (DUG), (DIG), (UNG), (USO), (OXY), (XLE), (X)
If you expect a trade war-induced global economic slowdown, the last thing in the world you want to own is an energy investment.
And so it was in Q4 when the price of oil got hammered doing a swan dive from $68 to $42 a barrel, an incredible 38% hickey.
All eyes will be focused on OPEC production looking for new evidence of quota cheating which is slated to expire at the end of 2018. Their latest production cut looked great on paper but proved awful in practice. Welcome to the Middle East.
The only saving grace is that with crude at these subterranean levels, new investment in fracking production has virtually ceased. No matter, US pipelines are operating at full capacity anyway.
OPEC production versus American frackers will create the constant tension in the marketplace for all of 2019.
My argument in favor of commodities and emerging markets applies to Texas tea as well. A weaker US dollar, trade war end, interest rate halt are all big positives for any oil investment. The cure for low oil prices is low prices.
That makes energy Master Limited Partnerships, now yielding 6-10%, especially interesting in this low yield world. Since no one in the industry knows which issuers are going bankrupt, you have to take a basket approach and buy all of them.
The Alerian MLP ETF (AMLP) does this for you in an ETF format.
Our train has moved over to a siding to permit a freight train to pass, as it has priority on the Amtrak system.
Three Burlington Northern engines are heaving to pull over 100 black, spanking brand new tank cars, each carrying 30,000 gallons of oil from the fracking fields in North Dakota.
There is another tank car train right behind it. No wonder Warren Buffett tap dances to work every day as he owns the railroad.
We are also seeing relentless improvements on the energy conservation front with more electric vehicles, high mileage conventional cars, and newly efficient building.
Anyone of these inputs is miniscule on its own. But add them all together and you have a game changer.
As is always the case, the cure for low prices is low prices. But we may never see $100/barrel crude again. In fact, the coming peak in oil prices may be the last one we ever see. The word is that leasing companies will stop offering five-year leases in five years because cars with internal combustion engines will become worthless in ten.
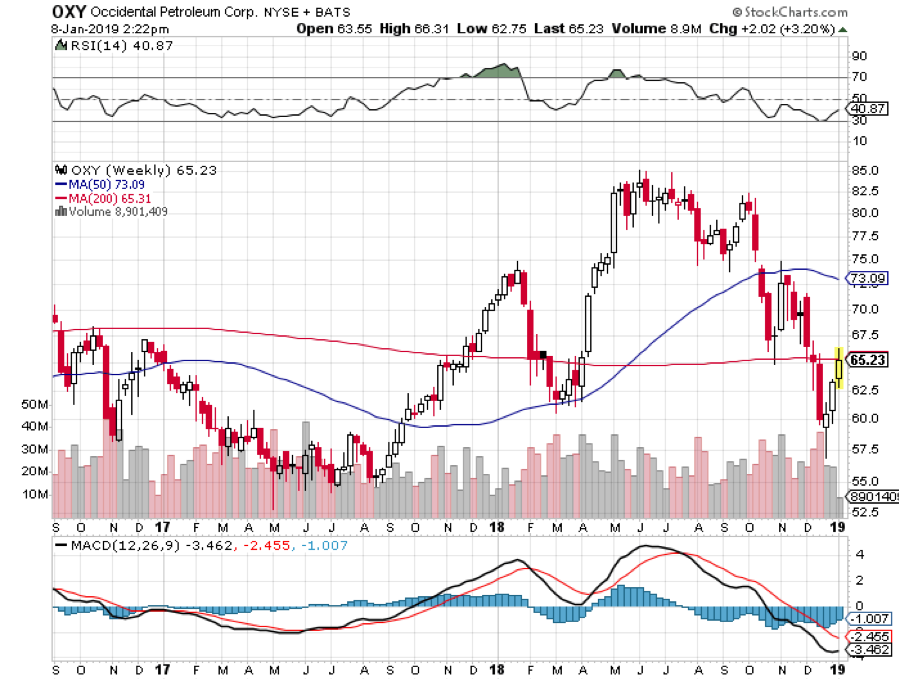
Add to your long-term portfolio (DIG), ExxonMobile (XOM), Cheniere Energy (LNG), the energy sector ETF (XLE), Conoco Phillips (COP), and Occidental Petroleum (OXY). But date these stocks, don’t marry them.
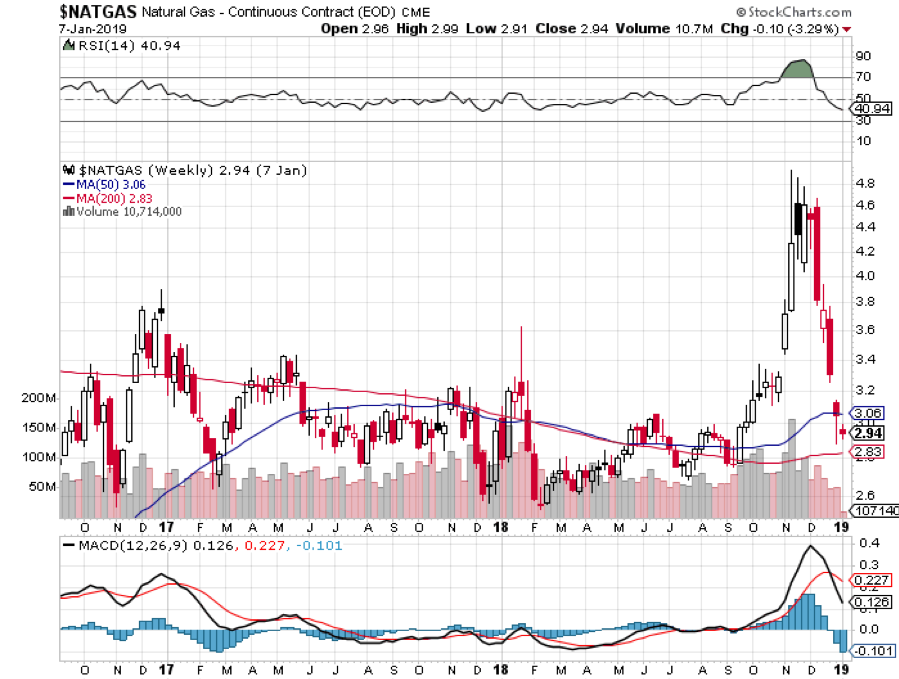
Skip natural gas (UNG) price plays and only go after volume plays because the discovery of a new 100-year supply from “fracking” and horizontal drilling in shale formations is going to overhang this subsector for a very long time, like the rest of our lives.
It is a basic law of economics that cheaper prices bring greater demand and growing volumes which have to be transported. Any increase in fracking creates more supply of natural gas.
7) Precious Metals (GLD), (DGP), (SLV), (PPTL), (PALL)
The train has added extra engines at Denver, so now we may begin the long laboring climb up the Eastern slope of the Rocky Mountains.
On a steep curve, we pass along an antiquated freight train of hopper cars filled with large boulders.
The porter tells me this train is welded to the tracks to create a windbreak. Once, a gust howled out of the pass so swiftly that it blew a train over on to its side.
In the snow-filled canyons, we sight a family of three moose, a huge herd of elk, and another group of wild mustangs. The engineer informs us that a rare bald eagle is flying along the left side of the train. It’s a good omen for the coming year.
We also see countless abandoned 19th century gold mines and the broken-down wooden trestles leading to them, relics of previous precious metals booms. So, it is timely here to speak about the future of precious metals.
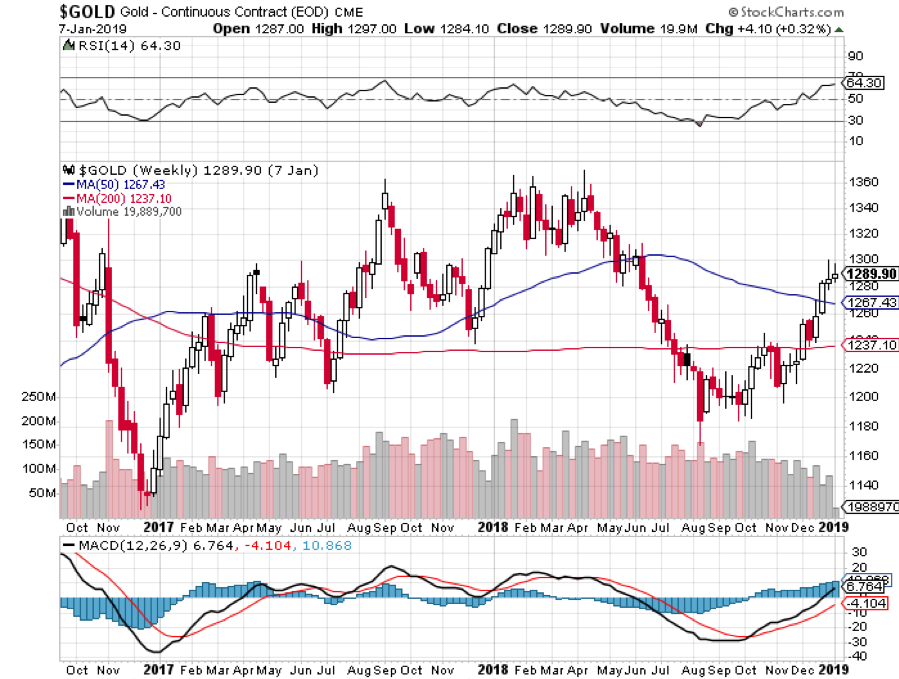
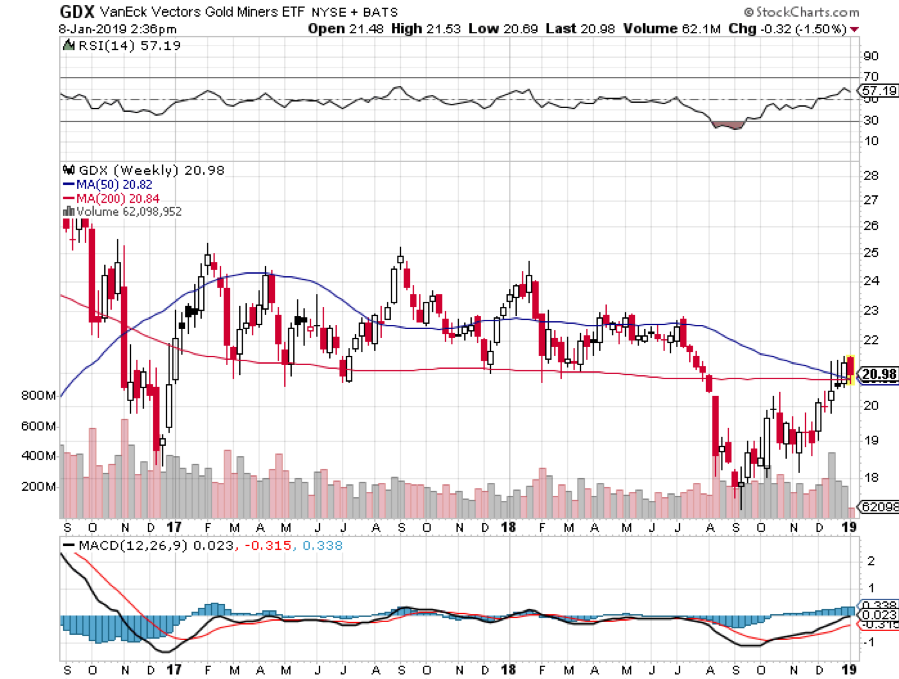
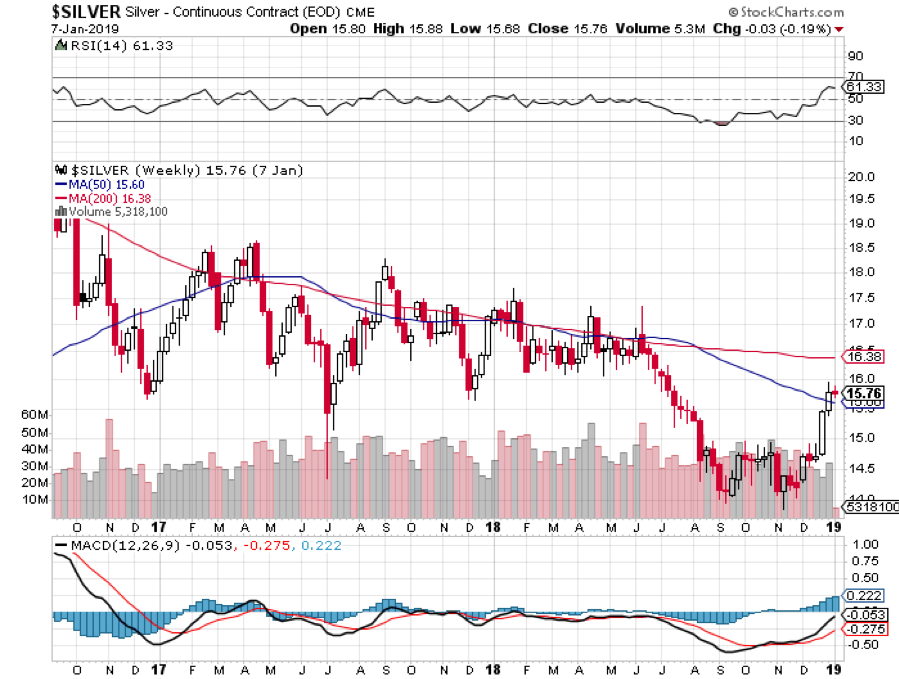
Gold (GLD) lost money in 2018, off 2.4%. More volatile silver (SLV) shed 12%.
This was expected, as non-yielding assets like precious metals do terribly during times of rising interest rates.
In 2019, gold will finally be coming out of a long dark age. As long as the world was clamoring for paper assets like stocks, gold was just another shiny rock. After all, who needs an insurance policy if you are going to live forever?
But the long-term bull case is still there. Gold is not dead; it is just resting.
If you forgot to buy gold at $35, $300, or $800, another entry point here up for those who, so far, have missed the gravy train.
To a certain extent, the belief that high-interest rates are bad for gold is a myth. Wealth creation is a far bigger driver. To see what I mean, take a look at a gold chart for the 1970s when interest rates were rising sharply.
Remember, this is the asset class that takes the escalator up and the elevator down, and sometimes the window.
If the institutional world devotes just 5% of their assets to a weighting in gold, and an emerging market central bank bidding war for gold reserves continues, it has to fly to at least $2,300, the inflation-adjusted all-time high, or more.
This is why emerging market central banks step in as large buyers every time we probe lower prices. China and India emerged as major buyers of gold in the final quarters of 2018.
They were joined by Russia which was looking for non-dollar investments to dodge US economic and banking sanctions.
That means it’s just a matter of time before gold breaks out to a new multiyear high above $1,300 an ounce. ETF players can look at the 1X (GLD) or the 2X leveraged gold (DGP).
I would also be using the next bout of weakness to pick up the high beta, more volatile precious metal, silver (SLV) which I think could rise from the present $14 and hit $50 once more, and eventually $100.
The turbocharger for gold will hit sometime in 2019 with the return of inflation. Hello stagflation, it’s been a long time.

Would You Believe This is a Purple State?
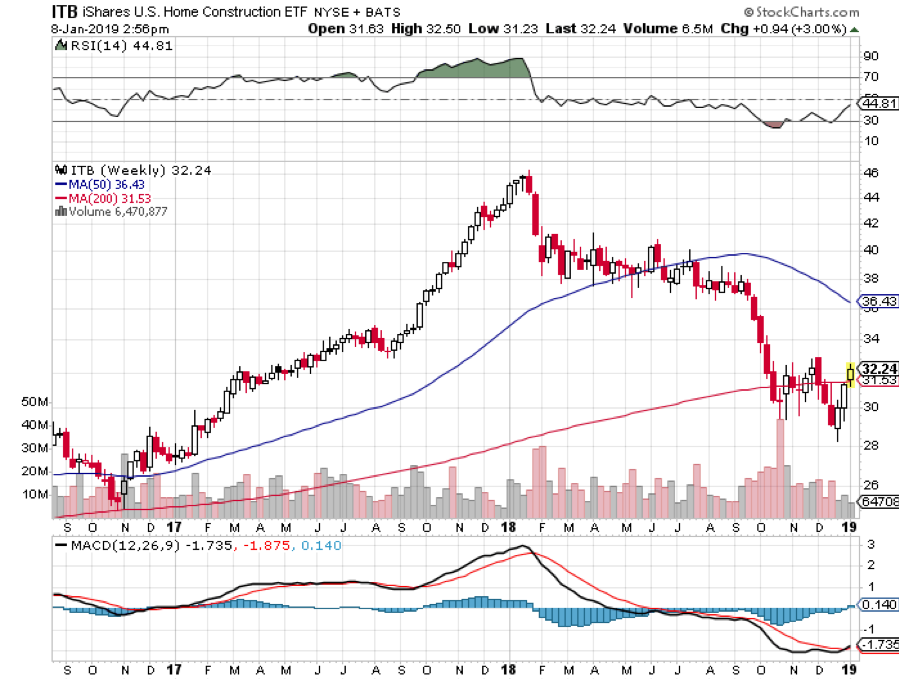
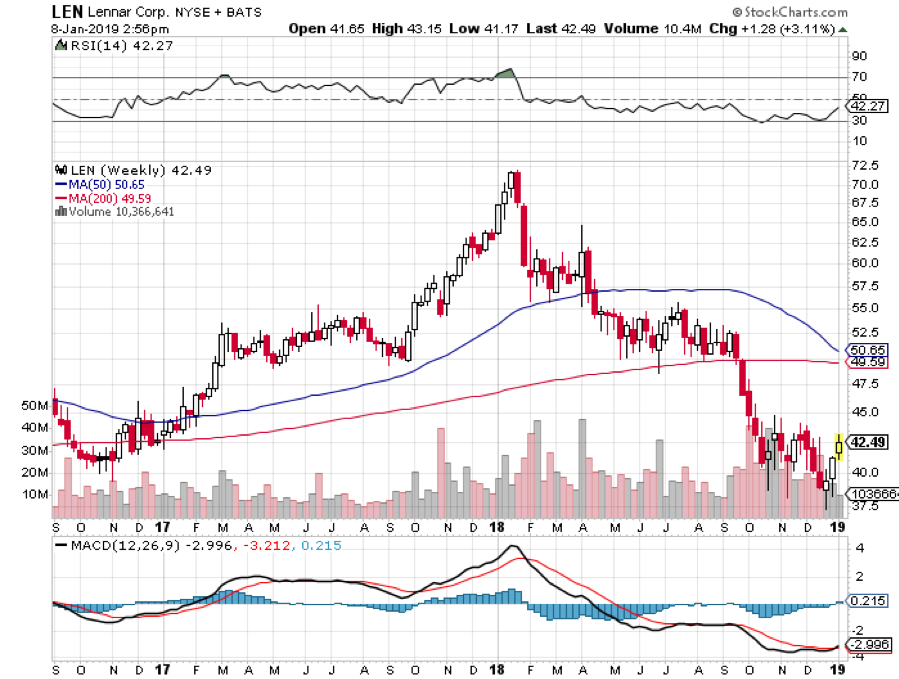
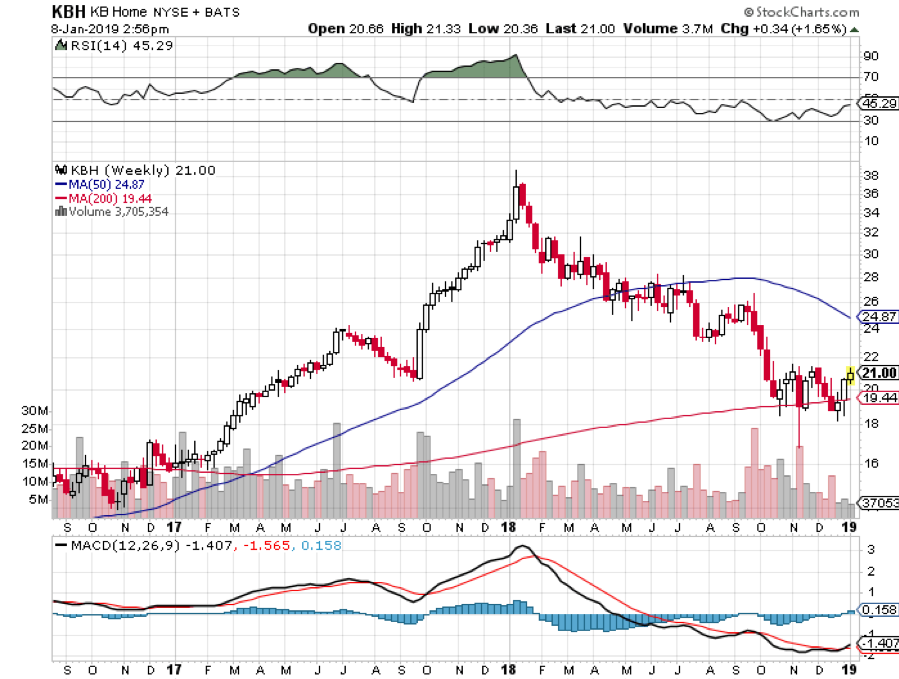
8) Real Estate (ITB), (LEN),
The majestic snow-covered Rocky Mountains are behind me. There is now a paucity of scenery with the endless ocean of sagebrush and salt flats of Northern Nevada outside my window, so there is nothing else to do but write.
My apologies in advance to readers in Wells, Elko, Battle Mountain, and Winnemucca, Nevada.
It is a route long traversed by roving bands of Indians, itinerant fur traders, the Pony Express, my own immigrant forebears in wagon trains, the transcontinental railroad, the Lincoln Highway, and finally US Interstate 80.
Passing by shantytowns and the forlorn communities of the high desert, I am prompted to comment on the state of the US real estate market.
There is no doubt a long-term bull market in real estate is taking a major break. If you didn’t sell your house by March last year you’re screwed and stuck for the duration.
And you’re doubly screwed if you’re trying to sell your home now during the government shutdown. With the IRS closed, tax return transcripts are unobtainable making any loan approval impossible. And no one at Fannie Mae or Freddie Mac, the ultimate buyers of 70% of US home loans, has answered their phone this year.
The good news is that we will not see a 2008 repeat when home values cratered by 50%-70%. There is just not enough leverage in the system to do any real damage. That has gone elsewhere, like in exchange-traded funds. You can thank Dodd/Frank for that which imposed capital rules so strict that it is almost impossible for banks to commit suicide.
And no matter how dire conditions may appear now, you are not going to see serious damage in a market where there is a generational structural shortage of supply.
We are probably seven years into a 17-year run at the next peak in 2028. What we are suffering now is a brief two-year pause to catch our breath. Those bidding wars were getting tiresome anyway.
There are only three numbers you need to know in the housing market for the next 20 years: there are 80 million baby boomers, 65 million Generation Xers who follow them, and 86 million in the generation after that, the Millennials.
The boomers have been unloading dwellings to the Gen Xers since prices peaked in 2007. But there is not enough of the latter, and three decades of falling real incomes mean that they only earn a fraction of what their parents made. That’s what caused the financial crisis.
If they have prospered, banks won’t lend to them. Brokers used to say that their market was all about “location, location, location.” Now it is “financing, financing, financing.” Imminent deregulation is about to deep-six that problem.
There is a happy ending to this story.
Millennials now aged 23-38 are already starting to kick in as the dominant buyers in the market. They are just starting to transition from 30% to 70% of all new buyers in this market.
The Great Millennial Migration to the suburbs has just begun.
As a result, the price of single-family homes should rocket tenfold during the 2020s as they did during the 1970s and the 1990s when similar demographic forces were at play.
This will happen in the context of a coming labor shortfall, soaring wages, and rising standards of living.
Rising rents are accelerating this trend. Renters now pay 35% of the gross income, compared to only 18% for owners, and less when multiple deductions and tax subsidies are taken into account.
Remember too that, by then, the US will not have built any new houses in large numbers in 12 years.
We are still operating at only a half of the peak rate. Thanks to the Great Recession, the construction of five million new homes has gone missing in action.
That makes a home purchase now particularly attractive for the long term, to live in, and not to speculate with. And now that it is temporarily a buyer’s market, it is a good time to step in for investment purposes.
You will boast to your grandchildren how little you paid for your house as my grandparents once did to me ($3,000 for a four-bedroom brownstone in Brooklyn in 1922), or I do to my kids ($180,000 for an Upper East Side high rise in 1983).
That means the major homebuilders like Lennar (LEN), Pulte Homes (PHM), and KB Homes (KBH) may finally be a buy on the dip.
Quite honestly, of all the asset classes mentioned in this report, purchasing your abode is probably the single best investment you can make now.
If you borrow at a 4% 5/1 ARM rate, and the long-term inflation rate is 3%, then over time you will get your house nearly for free.
How hard is that to figure out?
![]() Crossing the Bridge to Home Sweet Home
Crossing the Bridge to Home Sweet Home
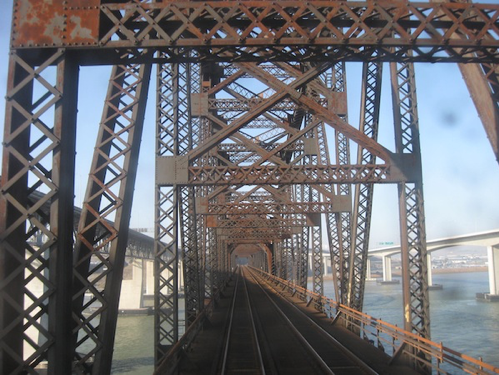 Crossing the Bridge to Home Sweet Home
9) Postscript
We have pulled into the station at Truckee in the midst of a howling blizzard.
My loyal staff has made the ten-mile treck from my beachfront estate at Incline Village to welcome me to California with a couple of hot breakfast burritos and a chilled bottle of Dom Perignon Champagne which has been resting in a nearby snowbank. I am thankfully spared from taking my last meal with Amtrak.
After that, it was over legendary Donner Pass, and then all downhill from the Sierras, across the Central Valley, and into the Sacramento River Delta.
Well, that’s all for now. We’ve just passed the Pacific mothball fleet moored near the Benicia Bridge. The pressure increase caused by a 7,200-foot descent from Donner Pass has crushed my water bottle.
The Golden Gate Bridge and the soaring spire of Salesforce Tower are just around the next bend across San Francisco Bay.
A storm has blown through, leaving the air crystal clear and the bay as flat as glass. It is time for me to unplug my MacBook Pro and iPhone X, pick up my various adapters, and pack up.
We arrive in Emeryville 45 minutes early. With any luck, I can squeeze in a ten-mile night hike up Grizzly Peak and still get home in time to watch the ball drop in New York’s Times Square.
I reach the ridge just in time to catch a spectacular pastel sunset over the Pacific Ocean. The omens are there. It is going to be another good year.
I’ll shoot you a Trade Alert whenever I see a window open at a sweet spot on any of the dozens of trades described above.
Good trading in 2019!
John Thomas
The Mad Hedge Fund Trader