When Dr. Copper (CU), the only commodity with a PhD in economics, suddenly collapses from a heart attack, risk takers everywhere have to sit up and take notice.
Since the 2011 top, the red metal has collapsed a shocking 40%. It has given back a nausea inducing 10% just in the last two weeks. Will copper take down the rest of the financial markets with it?
Is the bull case for risk assets over?
I doubt it.
So called because of its uncanny ability to predict the future of the global economy, copper is warning of dire things to come. The price drop suggests that the great Chinese economic miracle is coming to an end, or is at least facing a substantial slowdown, the government?s 7.5% GDP target for 2014 notwithstanding.
It?s a little more complicated than that. Copper is no longer the metal it once was. Because of the lack of a consumer banking system in the Middle Kingdom, individuals are now hoarding 100 pound copper bars and posting them as collateral for loans from banks or backstreet money lenders.
China is, in effect, on a copper standard. Get any weakness of the kind we have seen this year, and lenders panic, dumping their collateral for cash, crushing spot prices.
The latest plunge has been fueled by continuing rumors of an imminent Chinese banking crisis. The Middle Kingdom?s first corporate bond default in history, by a third tier solar company a few years ago, further heightened fears. The implicit government guarantee that was believed to back this paper suddenly went missing in action.
The high frequency traders are now in the copper futures and spot markets in force, whipping around prices and creating unprecedented volatility. Notice how they seem to be running the movie on fast forward everywhere these days? Because of this, we could now be seeing an overshoot on the downside in copper.
Copper, along with all other hard assets, have also been taking a pasting from the strong US dollar. A robust greenback has effectively raised the price of copper in non dollar currencies in big consuming countries, like Japan and Europe. The only way to adjust for this is for the traders to take down dollar prices, which the markets have been doing with a vengeance.
It is no coincidence that copper has been falling in almost perfect lockstep with the rest of the hard asset universe, including gold, silver, oil, natural gas, coal, all the ags and ag stocks, and the commodity producing currencies of the Australian (FXA) and Canadian (FXC) dollars. The world wants paper assets (stocks and bonds), and none of the stuff you can drop on your foot (thanks Dennis).
However, cheaper copper is ultimately great news for we copper consumers, as with everything else.
Watch Dr. Copper closely. At the first sign of any real bottom, you should load up on long dated calls for Freeport McMoRan (FCX), the world?s largest producer, which also has been similarly decimated. The leverage in the company is such that a 10% rise in the price of copper triggers a rapid 20% rise or more in (FCX) shares.
I can wax one here about major structural changes in the Chinese economy that are underway, as the real problem. As the Middle Kingdom shifts from an export driven economy to a domestic demand one, there is less need for the red metal and more need for silicon and brains. But this isn?t something you can trade off of today.
So what is copper really telling us? The longer-term charts show a prolonged bottoming process. If $2.90 fails, we could see a revisit to the five-year low at $2.50.
That?s your load the boat price. During the global synchronized economic recovery that is underway, you want to view every panic sell off in a single asset class like this as a gift.
There is one further hope for copper. The Shanghai stock market has been absolutely on fire this year, rocketing some 40% since June, even beating the heady US exchanges. When risk accumulation accelerates to this extent in the world?s largest copper consumer that is great news for copper.
The two asset classes are now wildly out of sync. Either Chinese stocks are ridiculously overpriced and soon have to crash to come back in line with the red metal. Or copper has to rise.
I vote for the latter. It could be your big New Year trade.
https://www.madhedgefundtrader.com/wp-content/uploads/2014/03/Pennies-e1417727294545.jpg299400Mad Hedge Fund Traderhttps://madhedgefundtrader.com/wp-content/uploads/2019/05/cropped-mad-hedge-logo-transparent-192x192_f9578834168ba24df3eb53916a12c882.pngMad Hedge Fund Trader2014-12-05 01:04:382014-12-05 01:04:38Here is Your Big New Year Trade
You can pay up to $17 a unit for (LINN) and have a good chance of making a quick, snapback profit.
All of a sudden, everyone I know in Texas, and there are quite a few of them, called to tell me to buy Linn Energy, all within the space of one hour. I summarize their diverse comments below.
We have reached a margin call induced capitulation sell off in Linn Energy this morning, when oil was trading as low as $64 a barrel at the European opening.
There were obviously also a couple of leveraged energy and commodity funds that blew up and are undergoing forced liquidation at the market.
Add to that all the individuals who bought (LINN) on margin when the yield was only 8% so they would take 16% home to the bank.
This has taken the price of the units down to an artificial, and hopefully temporary, low of $15.90. At that price, the yield was a mind blowing 17% (after all, this is California).
It was a classic ?Throwing out the baby with the bathwater? moment. (LINN) gets 54% of its $1.6 billion in revenues from natural gas, which has held up remarkably well in the energy melt down, thanks to the early arrival of the polar vortex this winter.
Only 22% of its income derives from oil related projects, and half of this is hedged in the futures market from any downside exposure in the price of oil, according to the company?s recent pronouncements. Linn has actually plunged more than oil from its recent peak.
Does a loss on 10% of its revenues justify a gut wrenching 50% drop in the units? I think not.
But then, I am being rational and analytical, and I can assure you that the energy markets are now anything but rational and analytical.
Its not like oil is going to stay this low forever. Try to buy oil for delivery in the futures market two years out, and it has already recovered to $75/barrel, and there is very little available at that price.
What happens when the price of something goes down? Demand increases, and that will be good for Linn Energy, which is inherently more of a volume play on gas and oil, not a price play.
Keep also in mind that the absurd salaries the company was paying for workers in the Midwest has also vaporized. Roustabouts can now be had for as little as $75,000 a year compared to $200,000 only six months ago. This will cut (LINN)?s costs quickly and flow straight to the bottom line.
Falling costs and rising volumes sound like a winning formula to me.
And if you have the courage to buy the units here on margin, the yield rockets to a breathtaking 34%. It therefore can?t stay this low for long.
Linn Energy, LLC is an independent oil and natural gas company based in Houston, Texas. It holds oil and gas producing assets in many parts of the United States: Mid-Continent, including properties in Texas, Louisiana, and Oklahoma; the Hugoton Basin in Kansas; the Green River Basin in Wyoming; East Texas; California, including the Brea-Olinda Oil Field in Los Angeles and Orange Counties; the Williston/Powder River Basin, which includes a position in the Bakken Formation; Michigan/Illinois; and the Permian Basin in Texas.
At the end of 2012, the firm reported proved reserves of 4,796 bcfe (billion cubic feet equivalent) of oil and gas combined. Of this total, 24% was crude oil, 54% natural gas, and 22% natural gas liquids.
Structured as a master limited partnership for tax purposes, the firm is required to pay out most of its cash reserve to unitholders (stockholders) each quarter as distributions, thereby ducking the double taxation of corporate taxation.
However Linn retains some attributes of a limited liability corporation, including giving voting rights to its unitholders. Linn Energy also operates a subsidiary, LinnCo, a C Corporation, which is subject to different tax rules from its parent company.
All we have to do is survive the near term volatility and Linn Energy will be a winner.
https://www.madhedgefundtrader.com/wp-content/uploads/2014/12/LINN-Energy.jpg313361Mad Hedge Fund Traderhttps://madhedgefundtrader.com/wp-content/uploads/2019/05/cropped-mad-hedge-logo-transparent-192x192_f9578834168ba24df3eb53916a12c882.pngMad Hedge Fund Trader2014-12-02 09:23:062014-12-02 09:23:06Loading Up On Linn Energy
With the price of oil (USO), (XLE) hitting an eye popping $64 this morning, in the wake of the failed OPEC summit in Vienna, it is clear that something long term, structural, and epochal is going on.
But what is it?
We mere mortals are blind to it, but the financial markets haven?t the slightest doubt. Blame the wisdom of crowds. There is something big going on somewhere.
So I thought it would be a good time to check in with my friend and expert on all things international, David Hale, of David Hale Global Economics.
I have been relying on David as my global macro economist for decades, and I never miss an opportunity to get his updated views.
The challenge is in writing down David?s eye popping, out of consensus ideas fast enough, because he spits them out in such a rapid-fire succession.
Since David is an independent economic advisor to many of the world?s governments, largest banks, and investment firms, I thought his views would be of riveting interest. For my last interview with David, please click here.
On November 21, David was on Capitol Hill testifying in front of congress about the implications of a peace deal with Iran. He was kind enough to pass on to me a transcript of his talk.
The Iran nuclear negotiations broke up last week, extending the deadline for the current round by another seven months, to June 2015.
What David had to say was eye opening. If successful, a deal would have momentous implications for not just the US, but the global economy as well.
All trade with Iran ceased in the wake of the overthrow of the Shah of Iran by fundamentalist religious fanatics led by the Ayatollah Khomeini in 1979. The tortuous yearlong Iran Hostage Crisis followed, and relations with the US went into a deep freeze.
US Secretary of State John Kerry certainly has his work cut out for him today. Iran and America deeply distrust each other and philosophically couldn?t be further apart. They have been fighting proxy wars against each other for three decades, both in the analogue and digital worlds.
Remember Stuxnet?
It also doesn?t engender Iranian trust that the US has decimated a half dozen Arab countries in 30 years, and has more than the means to continue on that path, if it so desires.
Now 35 years later, America and Iran oddly find themselves on the same side of the latest Middle Eastern conflict. Sunni extremist forces lead by ISIL has launched a full-scale invasion of Iraq, capturing about one third of the country, and butchering Shiite opponents along the way in true, barbaric, 14th century fashion.
It has not gone unnoticed in Tehran that steady US air attacks against ISIL have meshed nicely with Iranian ground support to accomplish the same, although ?officially? there has been no cooperation whatsoever.
Not surprisingly, nuclear talks between the two countries, long considered a pipedream and simmering on a distant back burner have suddenly come to life.
If successful, a nuclear deal with Iran would have momentous implications, for not just the US, but the global economy as well.
First and foremost, Iran would be able to increase its oil exports by 1 million barrels a day, and then 1.5 million barrels a day over 2-3 years. The deluge could take the price of Texas tea down to $50-$60 a barrel and keep it there for a while.
Such a collapse, down 56% from the June peak, would amount to a $400 billion annual tax cut for the global economy. It would add 0.2% a year of GDP growth for every $10 price drop.
So the boost that we have seen so far amounts to an impressive 1% growth pop. That is an enormous number, increasing the world?s projected economic activity by a full third.
Major energy importers, like Europe, Japan, China, and India would benefit mightily. The US would prosper as well, as one third of its oil still comes from abroad.
It would be a disaster for high cost energy exporters, including Russia, Venezuela, Nigeria, and Canadian tar sands.
Russia, in particular, would get it right between the eyes. Oil and gas account for a whopping 68% of Russian exports and 45% of government revenues. To defend a crashing Ruble, the central bank has embarked on a series of gut wrenching interest rate hikes.
Russia is now looking into the jaws of its own Great Recession. After seeing its economy shrink this year by -0.2%, it could nosedive by at least 5% in 2015.
When they talk about self-sufficiency, they really mean starvation. This is why I have been saying all along that the Ukrainian crisis is going nowhere, except to create buying powers for equity investors.
Venezuela is a basket case, depending on oil for 90% of its exports. Expect hyperinflation, leading to a headline grabbing default on its national debt. Political instability is to follow.
Another big plus for the world economy is the reemergence of Iran as a significant consumer. This is not a small country. It has a population of 78 million and a $369 billion GDP. Sanctions have successfully crippled the economy, shrinking its GDP by -5.8% in 2012 and another -1.9% last year.
The sanctions have not been a one-way street. They have cost the US a not inconsequential $175 billion in sales over the past 17 years. A rebound would lead to a surge of exports of consumer goods (iPhones), and oil drilling equipment to facilitate a long delayed modernization of the industry there.
A major roadblock to peace has been the Revolutionary Guard. Originally an elite group of fighters during the revolution, it has evolved into a modern day Mafia.
It controls the black market, smuggling and a host of other illegal activities, earning billions in illicit profits along the way. It has a vested interest in maintaining the status quo. War with America is good business for them.
Iran is now a classic case of where the government hates us, and the people love us.
To learn more about David Hale and the extensive list of services he offers; please visit the website of David Hale Global Economics, http://www.davidhaleweb.com.
https://www.madhedgefundtrader.com/wp-content/uploads/2013/09/David-Hale.jpg353305Mad Hedge Fund Traderhttps://madhedgefundtrader.com/wp-content/uploads/2019/05/cropped-mad-hedge-logo-transparent-192x192_f9578834168ba24df3eb53916a12c882.pngMad Hedge Fund Trader2014-12-01 09:16:002014-12-01 09:16:00An Iran Peace Deal and Your Portfolio
In recent weeks, I couldn?t help but notice the green and white vans of Solar City (SCTY) visiting my neighbors. My trader?s radar went up, so I thought there might be an opportunity here.
What I found made an intriguing investment opportunity. As a preeminent supplier of solar energy, Solar City is a de facto indirect call option on the price of oil, not a bad bet here at $74 and change.
As a huge consumer of capital, the company is a major beneficiary of the prolonged low interest rate scenario which I envision.
A 30% tax credit on any alternative energy investment is set to expire at the end of 2016. I think this will trigger the mother of all stampedes by consumers to buy solar systems while they can still get the government to pick up one third of the tab.
Solar City has also recently completed several high tech acquisitions which will enable it to lower costs while enhancing output efficiencies.
Did I mention that anything Elon Musk Touches turns to gold?
The stock here also looks attractive. Collapsing oil prices had a leveraged effect on (SCTY) shares, dropping a heart stopping 42% in only three months. Heaven knows investors are starved for cheap stocks these days.
This week, (SCTY) poked its nose above the 50 day moving average. If it hold?s then it is off to the races. My only concern here is the volatility that the Thursday OPEC meeting in Vienna is certain to bring to energy markets.
With my second Tesla (TSLA) about to be delivered, the Model X SUV, it was time for me to review my electricity bill.
My first Tesla, a very early Model S-1 (chassis number 125), boosted my monthly power consumption from 600 kWh to 1,800 kWh per month, about what a small industrial facility might use.
Yet, my bill from PG&E increased from only $350 to $450 a month. This is because they effectively give away power for free from 12:00 AM to 7:00 AM to qualified EV users, charging me only a scant 4.7 cents per kWh.
On my suggestion, Tesla then upgraded their software so vehicles could be programmed to recharge only at these hours. That means it is costing me $4.00 for a full 80 kWh charge that can take me 255 miles, or 1.6 cents a mile. That doesn?t include the enormous savings on maintenance (there is none).
Well then! The IRS currently allows a mileage deduction of 56 cents per mile for business purposes, so that?s an opportunity to exploit right there.
Given that the average US car now gets 25 miles per gallon of gasoline (and that is being generous), that means my equivalent cost for running my S-1 works out to paying a scant 40 cents a gallon.
This compares to the $2.79 at the local service station ($2.57 at Costco), which is at a four year low, or a savings of 86%. That is a little more than I paid for gas when I first started driving a beat up VW Bug at the Santa Anita Race Track parking lot back in 1967.
That sounds like a deal to me.
However, the second Tesla is likely to boost my monthly power consumption from 1,800 kWh to 3,000. When PG&E sees bills that big, they assume someone is operating an illegal marijuana grow house and send the DEA to kick your door down at 5:00 AM on a Monday morning.
So I was on the phone to Solar City the next morning. What I heard was nothing less than amazing.
For a start, they called up a Google Earth mapping program that focused on a picture of my roof from a low earth orbit satellite (Google has invested $280 million in Solar City). Then a second program autofits their existing solar panels to my roof and spit out a mass of numbers.
This complete stranger told me things about my roof that I never knew, like it was 4,000 square feet of flat concrete tiles on 14 planes. Welcome to the 21st century.
I nervously looked down and made sure my fly was fully zipped up.
He went on to tell me that he could fit a 15 kW DC system on my roof that would generate 106% of my power needs, generating 19,365 kWh a year. That would make me completely self sufficient in electricity, even though I will be charging two hulking Tesla 1,000 pound lithium ion batteries every day.
They will install a ?net? two-way electric meter on my house. When the sun shines, it will run backwards as I can sell power to PG&E at high prices. So many people are doing this now that the traditional afternoon price spike in electricity had virtually disappeared.
At night, when I recharge my cars, I would then buy cheap power from Solar City. No storage devices are required. The PG&E grid is effectively the storage system. That would turn me into a day trader of electricity, selling high by day and buying low by night. I love it!
How did their satellite know I was a hedge fund trader? What else does it know?
Now comes the best part. The cost of the installation and panels was $66,000. Solar City would do it for free. Yes, free, as in gratis, with no money down.
They would lease me the panels for 20 years, with an annual price increase of 6.2%. That would cut my monthly electricity bill from $450 to $200. It does this by eliminating the tier 3, 4, and 5 prices I am currently paying PG&E.
If I sell my house, I can either buy out my contract at the discounted, fully depreciated value, or pass it on to the new owners. It is well known that solar panels significantly increase the value of existing homes.
Installation can be done in a day. But it can only take place on unbreakable concrete tile roofs. Those made of clay tiles, metal, tar and gravel, wood shakes, or slate don?t work for various reasons. You need a FICO score of 680 or better to qualify. There is a 60-day waiting list to get this done.
It didn?t take me long to figure out the game here. By purchasing the panels and leasing them to me, they keep the 30% government subsidy for capital investments in alternative energy, which works out to $19,890 for my house alone. Solar City also gets to depreciate these panels on an accelerated schedule, mostly in the first five years.
This explains why Solar City has grown larger than the next 15 competitors combined. Solar City?s largest customer is the US Army, which has already installed panels on 1 million structures.
There is one cautionary note to add here. The government subsidies that help float the company expire in 2018, making the entire proposition financially less attractive. That is, unless they get renewed. Think President Hillary.
The only things that would save them are dramatically higher conventional energy costs. However, right now energy costs are heading the opposite direction, thanks to fracking and a well-publicized war for market share at OPEC.
As with everything else Elon Musk touches, an investment in Solar City has been wildly successful. Since the company went public at the end of 2012, the shares have risen by an awesome 670%. Needless to say, with no earnings, and no dividend, the $5.5 billion market cap company may appear hopelessly expensive.
Like with Elon?s other company, Tesla, you aren?t betting on the value of the business today, but where it will be in five years, when it has a far larger share of the market.
Given Musk?s track record so far, that is a bet that I am willing to take.
https://www.madhedgefundtrader.com/wp-content/uploads/2014/11/Solar-Shields-e1416930698610.jpg274400Mad Hedge Fund Traderhttps://madhedgefundtrader.com/wp-content/uploads/2019/05/cropped-mad-hedge-logo-transparent-192x192_f9578834168ba24df3eb53916a12c882.pngMad Hedge Fund Trader2014-11-26 01:03:252014-11-26 01:03:25Loading the Boat with Solar City
Any doubts that my bullish call on global risk markets would play out as promised were blown away on Friday.
That was when the central banks of China and Europe delivered a surprise, one two punch of monetary stimulus for their own troubled economies. The quantitative easing baton has successful been passed from America?s Federal Reserve to central bankers abroad.
The net net for you and I is that stocks and the dollar will continue to appreciate.
Specifically, China came out of the blue with a 0.4% interest rate cut, thus stimulating the world?s largest emerging market.
Then the European Central Bank?s president, Mario Draghi, said he would take whatever steps necessary to return the continent to a 2% inflation rate, up from today?s 0.40%. Unbelievably, Spanish ten-year bond yield fell below 2% in a heartbeat and German ten year funds pierced 0.80%.
For good measure, the Japanese central bank then chimed in, boosting the country?s money supply growth by 33% as promised earlier. Saying is one thing, but doing it is much better, especially when it carries a radical tinge.
The measures make my 2,100 target for the S&P 500 by the end of December a pretty safe bet. Look for a tedious, prolonged sideways grind, followed by rapid headline driven pop. Easy entry points will be few.
It really is one of those ?Close your eyes and buy? type of markets. I doubt we get pullback of less than 3% in the major indexes this year. Volatility will remain muted. All the black swans of landed.
It gets better.
This kind of market action could continue for another three years. After the ?Great Recession?, we are now witnessing the ?Great Recovery?. That means returning to a 3% or better GDP growth rate and 10% annual corporate earnings increases.
Add in 2% a year in dividend yields, and you get a (SPY) that rises by 10% a year. Look at the 100-year average gain for stocks and it comes in remarkably close to this number. Factor in an earnings multiple increase from the current 16, and they will rise faster.
This is all Goldilocks on steroids. Interest rates, the cost of labor, energy, and commodity price inputs stay low, earnings rise, and everybody else in the world sends their money here because it is the best bet going.
https://www.madhedgefundtrader.com/wp-content/uploads/2014/08/John-Thomas-Beach-e1416856744606.png400276Mad Hedge Fund Traderhttps://madhedgefundtrader.com/wp-content/uploads/2019/05/cropped-mad-hedge-logo-transparent-192x192_f9578834168ba24df3eb53916a12c882.pngMad Hedge Fund Trader2014-11-25 01:05:412014-11-25 01:05:41The Yearend Melt Up Has Started!
Those of you who recently purchased the Mad Hedge Fund Trader?s mentoring service may have noticed a sudden drop off in Trade Alerts.
During October, I sent out a record 44 Alerts and Updates. As a result, that month was my best of the year, bringing in a gain of 6.69%. This month, only 5 Trade Alerts have gone out.
What gives?
I assure you, I have not been basking in the sun on a yacht in the Caribbean. Nor have I been catching the end of the ski season on New Zealand?s South Island. I have not even taken off on a hundred mile snowshoe across the High Sierras (that is not scheduled until Thanksgiving week).
No, I?m afraid that I have to tell you that the problem has been the market. I like to focus on sending out Trade Alerts that have an overwhelming chance of success. The fundamentals, the technical?s, the sun, moon, and stars all have to line up perfectly.
When they don?t, I don?t trade. It?s called maintaining discipline. The same is true for my friend, Mad Day Trader, Jim Parker. Sometimes, the best trades are the ones you think about, but never do, because your models say ?Stay away!?
When I ran my big hedge fund during the 1990?s I developed a perfect leading indicator. It was based my own clients? cash flows. When money poured in, it reliably signaled a market top. When it flowed out, it presciently indicated a market bottom.
It made absolutely no difference what my own performance was. If I was up 40% on the year, and the stock market dove 10%, investors wanted their money back?and now! No excuses, no explanations.
When investors wanted to redeem, I bought them out with my own money. Eventually, over the years, I ended up owning the entire hedge fund, which I then sold at a big premium at the market top to a group of foreign investors.
The closing date was January 1, 2000, four months before the beginning of the Great Dotcom crash. People told me I was stupid for four months?then I never heard from them again, except to occasionally see their resumes put in front of me by hopeful headhunters.
I am seeing the same sort of behavior in the newsletter business. Market surges bring in large numbers of new subscribers, who then expect immediate gratification in the form of a ton of Trade Alerts. At market bottoms the PayPal account goes completely dormant.
If I met new subscriber expectations, I would create a perfect money destruction machine, one that mechanically buys tops and sells bottoms. That is a great way to buy a spanking brand new mega yacht for your broker, but not for yourself.
So what should you expect from the Mad Hedge Fund Trader? To get buried in Trade Alerts when conditions are ideal, and sit on your hands when they aren?t.
That is when you?re supposed to be reading those deep, insightful research pieces that I send you every day, and drawing up short lists of things to do when the call to action arises. Chance rewards the prepared.
Keeping you out of a high risk/low return market is a far more valuable service that I can provide than tying you to a low risk/high return one.
Hint: Just because you bought a new subscription to the Global Trading Dispatch doesn?t mean that trading conditions have suddenly become ideal.
If you have to wait for an entire market cycle for the sweet spots to start appearing in large numbers, that is the best way to protect and expand your wealth. Market discipline is the most valuable thing I can teach you.
With all that said, let?s talk about the markets.
This is a particularly tricky place for traders. The lowest risk day of the year to buy stocks was October 15. Since then, the risks have increased daily. We are now at the top of one of the extended runs in market history. Should we throw caution to the wind and buy with reckless abandon?
Hell no!
So maybe we should consider flipping to the short side?
We have just entered the six-month period when stocks are traditionally the strongest. You can add to this big upward influence the end of the year run up.
In fact, I think we will close 2014 at the high of the year. Looking at the way the Volatility Index (VIX) is trading, it could be another three years before we see another full 10% correction.
So I don?t think that selling short any risk asset is a good idea here either.
That leaves us the small weekly 1%-2% mini corrections we have been getting to get involved with on the long side. But since we are running into the annual book closing, you have to use tight stop losses to protect your investment.
The high frequency traders all know this, and will program their algorithms to trigger as many stop losses as possible before reversing markets. That?s how I lost my long vertical call spread in Alibaba (BABA) this year, for a -2.38% hickey.
This is why I wrote in the Trade Alert that short term traders should sell, but long-term investors should hold. I think the stock is going to $140 next year.
Long-term investors have no problem. My fundamental economic call remains unchanged. Analysts and investors alike are underestimating the strength of the US economy.
Almost every data point confirms my convictions. Everyone else is shocked, befuddled, and bemused. Not me.
So, this bull market could continue for three or more years, and all they need to do is take an extended cruise when the markets suffer their periodic corrections.
This is why those owning the deepest discount Vanguard index funds have outperformed both active and hedge fund mangers for the third year running.
https://www.madhedgefundtrader.com/wp-content/uploads/2014/11/Golfer.jpg430320Mad Hedge Fund Traderhttps://madhedgefundtrader.com/wp-content/uploads/2019/05/cropped-mad-hedge-logo-transparent-192x192_f9578834168ba24df3eb53916a12c882.pngMad Hedge Fund Trader2014-11-21 01:04:592014-11-21 01:04:59Trade Alert Drought Explanation and My Market Take
Traders in Japan suffered a rude awakening yesterday morning when the Ministry of International Trade and Industry announced that the troubled country?s GDP shrunk by -1.6% during the third quarter. Analysts had been expecting a gain of 2.2%.
What?s worse, this is the second consecutive quarter of negative GDP, meaning that the Land of the Rising Sun is now solidly in recession, the fourth since 2008, and the umpteenth since the country fell off a demographic cliff 25 years ago.
The Nikkei Average took it on the kisser, plunging some 3% from its high for the year. The Wisdom Tree Japan Hedged Equity ETF (DXJ) declined by half as much.
Half of the gain since the Bank of Japan?s ?shock and awe? monetization measures on October 15 went up in smoke. Now we know why the central bank had been so aggressive and preemptive.
There are immediate implications from the dismal numbers. Prime Minister Shinzo Abe is almost certain to delay a hike in Japan?s VAT sales tax from 8% to 10% scheduled for the new fiscal year starting April 1.
This year?s rise, from 5% to 8%, is viewed as the chief culprit responsible for the shocking slowdown.
It turns out that clever consumers rushed to beat the tax, pulled their spending forward, creating an artificial boost to economic growth in the first quarter. This lulled the government and Japanese retailers, into thinking their recovery strategy was working.
After the tax increase took effect, the spending boom ground to a complete halt, and the economy came to a juddering stop. The end result was a huge inventory build that was the most destructive aspect of the terrible GDP numbers, as higher prices caused consumers to stay away from the stores in droves.
The conservative Abe was behind the government?s grab for more revenues to head off the country?s runaway budget deficit, which is now seen by many economists as reaching catastrophic proportions, some 160% of total GDP.
The problem is that governments should balance budgets when they can, not when they want to. I have lost count of how many Japanese recoveries have been smothered in the cradle by premature tax increases over the last two decades.
Thank goodness the US government had the sense not to try that here, or we?d all be standing in breadlines by now.
The global implications of a new Japanese recession are, fortunately, not as dire. It?s not like many analysts had built in a Japanese economic miracle into their long-term growth forecasts. Japan only accounts for 7% of world GDP these days, and losing a couple percent of that annualized doesn?t move the needle much.
The fall of the Japanese yen this year has been so rapid and dramatic that there hasn?t nearly been enough time for it to have a positive impact on the economy. It will going forward. That alone should pull the country back out of recession in the current quarter.
Remember too that since Japan is far more dependent than America on imported energy, it will benefit greater from the ongoing collapse in the price of oil.
The disastrous GDP numbers should also encourage the BOJ to become even more aggressive in its own reflationary efforts. Think more growth of the money supply, more quantitative easing, and faster. Buy Japanese printing press stocks!
Fortunately, all of these global, multi market cross currents distill down into a single trade for you and I: sell more yen.
A substantially weaker Japanese currency seems to be the one stop solution for all of Japan?s many intractable problems.
You already saw this in action in the foreign currency markets on Monday after the GDP numbers came out. Normally, a downside surprise of this magnitude on the economic data front generates a big ?flight to safety? move across all asset classes. That would have caused the Japanese yen to rise sharply against the buck.
Not this time. In fact, it barely moved. Japan and yen bears weren?t waiting a nanosecond to sell short more of the beleaguered currency, offsetting whatever profit taking there was from pre existing shorts the GDP figures might have incited.
So the set up here is to sell short the Currency Shares Japanese Yen Trust ETF (FXE), or to buy the 2X ProShares Ultra Short Yen ETF (YCS), two positions I have been recommending non stop for the past three years.
It looks like we have only just gotten started with out big down move in the yen.
Foreign exchange traders are an odd lot. They tend to maintain a laser like focus on specific numbers that are utterly meaningless to us mere mortals, but which have momentous importance to themselves.
Right now, one is hearing the battle cry over the 120/120 targets. Specifically, traders want to take the yen down to Y120 to the US dollar, and the Euro down to $1.20 by the last trading day of 2014.
They may well get their wishes.
Powering the moves is the biggest policy divergence between central banks in a decade. The US Federal is threatening to take interest rates up every other day.
In the meantime, lower interest rates beckon in Europe and Japan as their economies lurch from one disaster to the next, dragging their own currencies down.
Accelerating the move is the gasoline that has been thrown on the economic fires caused by? You guessed it, plunging gasoline prices in the US, which is quickly turning into a massive stimulus program.
Wonder why Wal-Mart (WMT) has suddenly taken off to the races? It?s because their impoverished, gap toothed customers have suddenly received big cash bonuses, thanks to the war for market share among the members of OPEC.
Even a penny drop in the price of petrol adds $1 billion a year in consumer spending. Gas is so cheap that we might even break the $3 level here in high tax California.
Higher interest rates are great for the greenback because they prompt foreign investors to send more money here faster to chase higher returns than available at home.
The sharpest bond market move in history, taking ten year Treasury yields from 1.86% all the way up to 2.38% in four weeks, makes this view even more convincing.
Followers of this letter already know that the currencies have been in deep doo doo all year. That?s why I have been aggressively pushing out Trade Alerts to buy the dollar (UUP) and sell short the Euro (FXE), (EUO) and the Japanese yen (FXY), (YCS) for the past six months.
Readers have been laughing all the way to the bank.
The really thrilling part here is that this is only the beginning of a decade long move. My final target for the yen is Y150 and $1.00 for the Euro. This could be the trade that keeps on giving.
There are also important spillover implications for the stock market. It means more money for stocks at higher prices. The S&P 500 at 2,100 by yearend now looks like a chip shot, and we may probe even higher.
So why am I currently lacking any current positions in the currencies in my model trading portfolio? We are now at the end of extreme moves in all asset classes over the past month.
So, while everything looks hunky dory (a street in Yokohama where the cheap geishas used to hang out) in the markets, risk is, in fact, rising.
I have to admit that, being up 42.5% year to date, I have gotten spoiled. I am holding back for the low risk, high return type of entry points for new trades that my readers have become addicted to.
When I see one, you?ll be the first to know. Watch this space.
Be nice to investors on the way up, because you always meet them again on the way down. This is the harsh reality of those who have placed their money in the fracking space this year.
The hottest sector in the market for the first half of the year, investors have recently fallen on hard times, with the price of oil collapsing from a $107 high in June to under $77 this morning, a haircut of some 28% in just five months.
Prices just seem to be immune to all the good news that is thrown at them, be it ISIL, the Ukraine, or Syria.
It wasn?t supposed to be like that. Using this revolutionary new technology, drillers are in the process of ramping up US domestic oil production from 6 million to 10 million barrels a day.
The implications for the American economy have been extraordinarily positive. It has created a hiring boom in the oil patch states, which has substantially reduced blue-collar unemployment. It has added several points to US GDP growth.
It has also reduced our dependence on energy imports, from a peak of 30 quadrillion Btu?s in 2005 to only 13 quadrillion Btu?s at the end of last year. We are probably shipping in under 10 quadrillion Btu?s right now, a plunge of 66% from the top in only 9 years.
The foreign exchange markets have taken note. Falling imports means sending hundreds of billions of dollars less to hostile sellers abroad. Am I the only one who has noticed that we are funding both sides of all the Middle Eastern conflicts? The upshot has been the igniting of a huge bull market in the US dollar that will continue for decades.
That has justified the withdrawal of US military forces in this volatile part of the world, creating enormous savings in defense spending, rapidly bringing the US Federal budget into balance.
The oil boom has also provided ample fodder for the stock market, with the major indexes tripling off the 2009 bottom. Energy plays, especially those revolving around fracking infrastructure, took the lead.
Readers lapped up my recommendations in the area. Cheniere Energy (LNG) soared from $6 to $85. Linn Energy (LINE) ratcheted up from $7 to $36. Occidental Petroleum moved by leaps and bounds, from $35 to $110.
Is the party now over? Are we to dump our energy holdings in the wake of the recent calamitous falls in prices?
I think not.
One of the purposes of this letter is to assist readers in separating out the wheat from the chaff on the information front, both the kind that bombards us from the media, and the more mundane variety emailed to us by brokers.
When I see the quality of this data, I want to throw up my hands and cry. Pundits speculate that the troubles stem from Saudi Arabia?s desire to put Russia, Iran, the US fracking industry, and all alternative energy projects out of business by pummeling prices.
The only problem is that these experts have never been to Saudi Arabia, Iran, the Barnett Shale, and wouldn?t know which end of a solar panel to face towards the sun. Best case, they are guessing, worst case, they are making it up to fill up airtime. And you want to invest your life savings based on what they are telling you?
I call this bullpuckey.
I have traveled in the Middle East for 46 years. I covered the neighborhood wars for The Economist magazine during the 1970?s.
When representing Morgan Stanley in the firm?s dealings with the Saudi royal family in the 1980?s, I paused to stick my finger in the crack in the Riyadh city gate left by a spear thrown by King Abdul Aziz al Saud when he captured the city in the 1920?s, creating modern Saudi Arabia.
They only mistake I made in my Texas fracking investments is that I sold out too soon in 2005, when natural gas traded at $5 and missed the spike to $17.
So let me tell you about the price of oil.
There are a few tried and true rules about this industry. It is far bigger than you realize. It has taken 150 years to build. Nothing ever happens in a hurry. Any changes here take decades and billions of dollars to implement.
Nobody has ever controlled the market, just chipped away at the margins. Oh, and occasionally the stuff blows up and kills you.
As one time Vladimir Lenin advisor and Occidental Petroleum founder, the late Dr. Armand Hammer, once told me, ?Follow the oil. Everything springs from there.?
China is the big factor that most people are missing. Media coverage has been unremittingly negative. But their energy imports have never stopped rising, whether the economy is up, down, or going nowhere, which in any case are rigged, guessed, or manufactured. The major cities still suffer brownouts in the summer, and the government has ordered offices to limit air conditioning to a sweltering 82 degrees.
Chinese oil demand doubled to 8 million barrels a day from 2000-2010, and will double again in the current decade. This assumes that Chinese standards of living reach only a fraction of our own. Lack of critical infrastructure and storage prevents it from rising faster.
Any fall in American purchases of Middle Eastern oil are immediately offset by new sales to Asia. Some 80% of Persian Gulf oil now goes to Asia, and soon it will be 100%. This is why the Middle Kingdom has suddenly started investing in aircraft carriers.
So, we are not entering a prolonged, never ending collapse in oil prices. Run that theory past senior management at Exxon Mobil (XOM) and Occidental (OXY), as I have done, and you?ll summon a great guffaw.
It will reorganize, restructure, and move into new technologies and markets, as they have already done with fracking. My theory is that they will buy the entire alternative energy industry the second it become sustainably profitable. It certainly has the cash and the management and engineering expertise to do so.
What we are really seeing is the growing up of the fracking industry, from rambunctious teenage years to a more mature young adulthood. This is its first real recession.
For years I have heard complaints of rocketing costs and endless shortages of key supplies and equipment. This setback will shake out over-leveraged marginal players and allow costs to settle back to earth.
Roustabouts who recently made a stratospheric $200,000 a year will go back to earning $70,000. This will all be great for industry profitability.
What all of this means is that we are entering a generational opportunity to get into energy investments of every description. After all, it is the only sector in the market that is now cheap which, unlike coal, has a reasonable opportunity to recover.
Oil will probably hit a low sometime next year. Where is anybody?s guess, so don?t bother asking me. It is unknowable.
When it does, I?ll be shooting out the Trade Alerts as fast as I can write them.
Where to focus? I?ll unfurl the roll call of the usual suspects. They include Occidental Petroleum (OXY), Exxon Mobil (XOM), Devon Energy (DVN), Anadarko Petroleum (APC) Cabot Oil & Gas (COG), and the ProShares 2X Ultra Oil & Gas ETF (DIG).
Fracking investments should be especially immune to the downturn, because their primary product is natural gas, which has not fallen anywhere as much as Texas tea. Oil was always just a byproduct and a bonus.
CH4 was the main show, which has rocketed by an eye popping 29% to $4.57 in the past two weeks, thanks to the return of the polar vortex this winter. We are now close to the highs for the year in natural gas.
The cost of production of domestic US oil runs everywhere from $28 a barrel for older legacy fields, to $100 for recent deep offshore. Many recent developments were brought on-stream around the $70-$80 area. So $76 a barrel is not the end of the world.
On the other hand, natural gas uniformly cost just under $2/Btu, and that number is falling. Producers are currently getting more than double that in the market.
And while on the subject of this simple molecule, don?t let ground water pollution ever both you. It does happen, but it?s an easy fix.
Of the 50 cases of pollution investigated by MIT, most were found to be the result of subcontractor incompetence, natural causes, or pollution that occurred 50 or more years ago. Properly regulated, it shouldn?t be happening at all.
When I fracked in the Barnett Shale 15 years ago, we used greywater, or runoff from irrigation, to accelerate our underground expositions. The industry has since gotten fancy, bringing in highly toxic chemicals like Guar Gum, Petroleum Distillates, Triethanolamine Zirconate, and Potassium Metaborate.
However, the marginal production gains of using these new additives are not worth the environmental risk. Scale back on the most toxic chemicals and go back to groundwater, and the environmental, as well as the political opposition melts away.
By the way, can any readers tell me if my favorite restaurant in Kuwait, the ship Al Boom, is still in business? The lamb kabob there was to die for.
https://www.madhedgefundtrader.com/wp-content/uploads/2014/11/Fracking.jpg325362Mad Hedge Fund Traderhttps://madhedgefundtrader.com/wp-content/uploads/2019/05/cropped-mad-hedge-logo-transparent-192x192_f9578834168ba24df3eb53916a12c882.pngMad Hedge Fund Trader2014-11-12 10:03:382014-11-12 10:03:38Why Fracking Will Make Your 2015 Performance
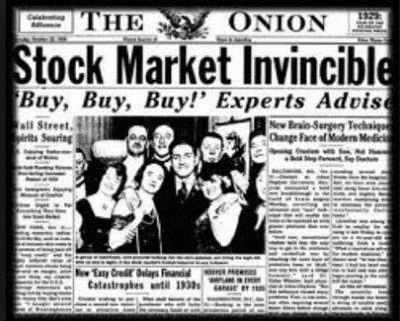
?Be Fearful When Others Are Greedy, and Greedy When Others Are Fearful.?
That is one of my favorite quotes from Oracle of Omaha, Warren Buffet, and it was never more true than during the past 30 trading days.
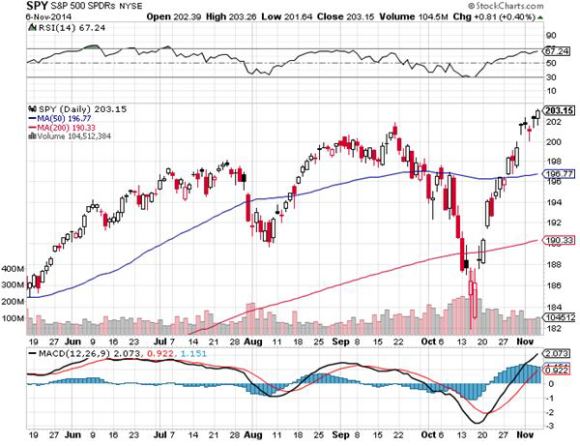
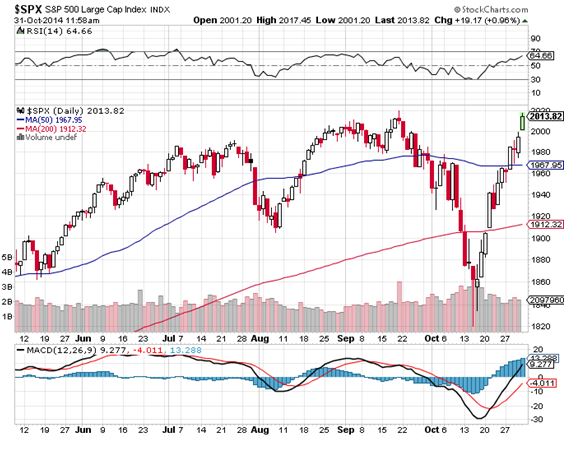
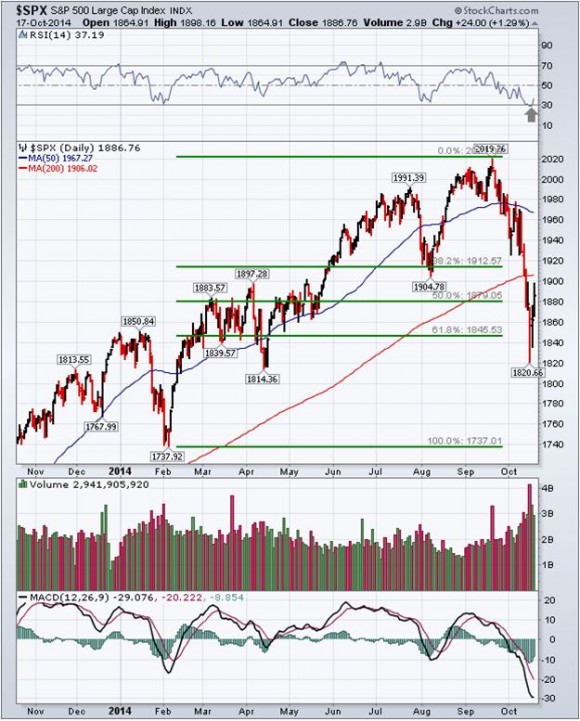
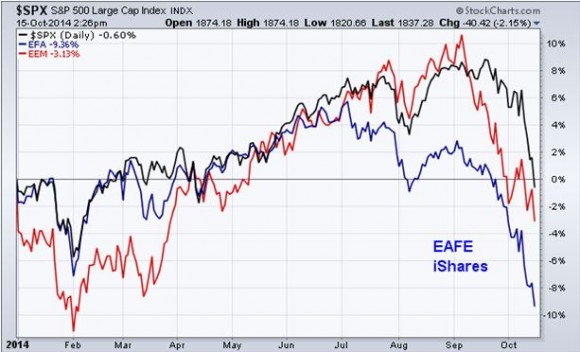
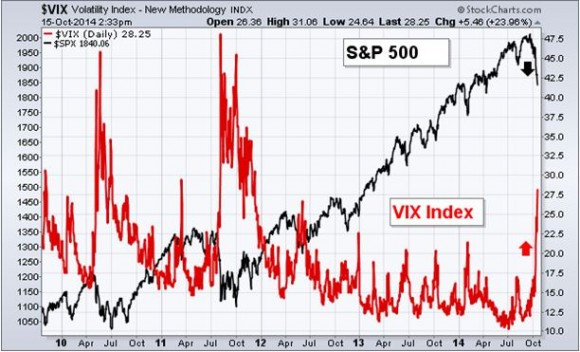
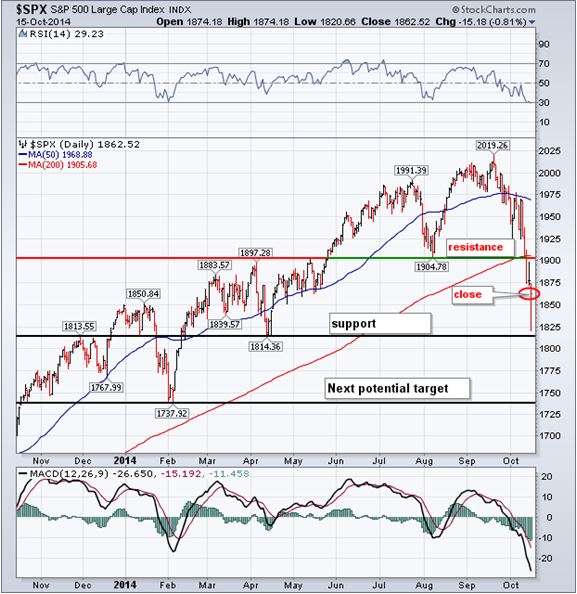
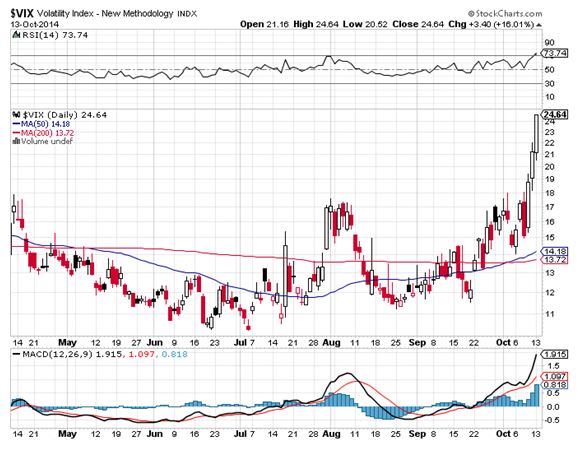
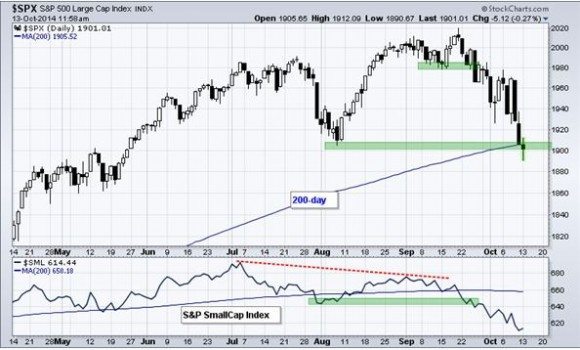
It turns out that the lowest risk day to buy stocks in 2014 was October 15, when we saw a giant, capitulation, spike low in the S&P 500 (SPY) down to $182.
That was the most fearful day I can recall over the last three years. You wouldn?t believe how many people I begged not to sell out entire portfolios that day!
So where are we now with the markets? Go back to the beginning of that legendary quote, and the word ?fearful? really stands out.
That means traders are stuck right back in the uncomfortable position in which they have spent most of this year.
Do I try to play catch up here and chase the market for a few extra basis points of performance, even at the risk of enduring another calamitous selloff? Or do I sit here in cash and earn precisely zero and get fired at the end of the year?
It is a choice that would truly vex Salomon. But as a king, at least he had job security.
We are now entering the tag ends of 2014, with only 36 trading days left, including three half days. I think it is safe to say that the trends that have predominated since January 1 will continue. Expect markets to continue to over reward risk takers and over punish risk avoiders.
That means there are only three trades in the world to execute:
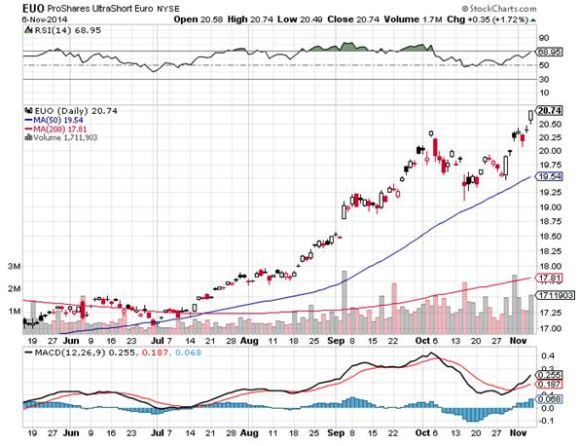
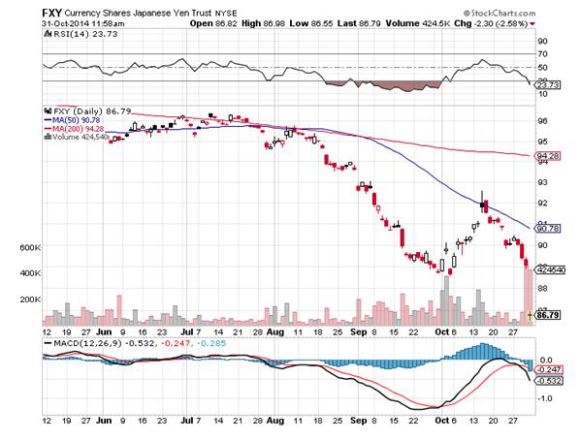
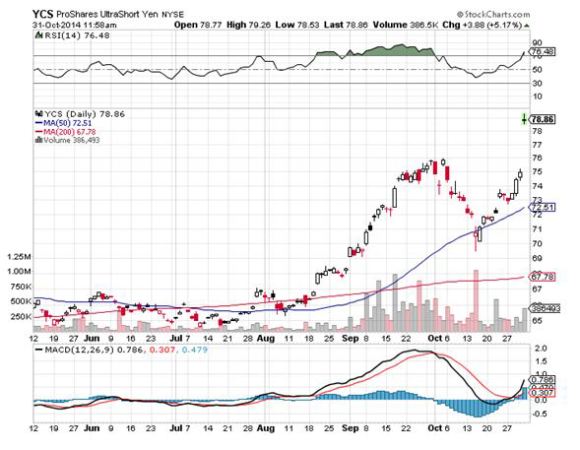
1) Buy the US Dollar
A yield advantage for the greenback is sucking in capital from all over the world. Concerns about principal risk is a further driver, creating a ?flight to safety? of prodigious proportions. Thanks to the collapse in energy prices and a ramp up in US domestic production, dollar outflows from America are at decade lows.
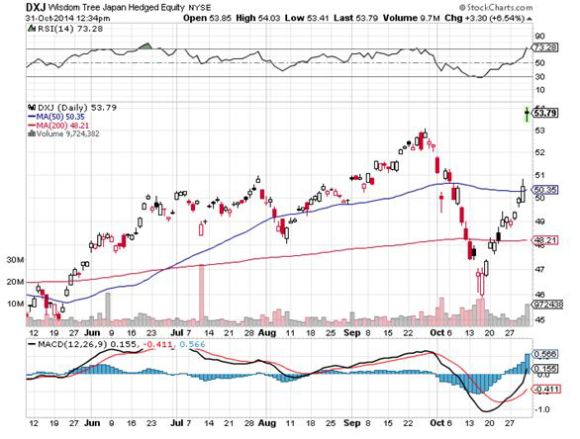
This can only mean that we are at the beginning of a multi year bull market in the buck. Sell short the Japanese yen (FXY) and the Euro (FXE), and buy the 2X short yen ETF (YCS), and the 2X short Euro ETF (EUO).
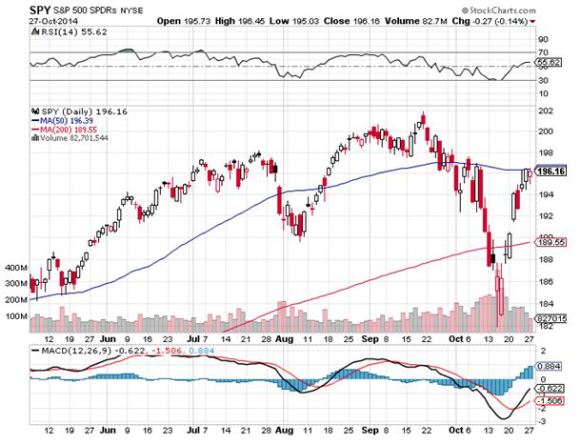
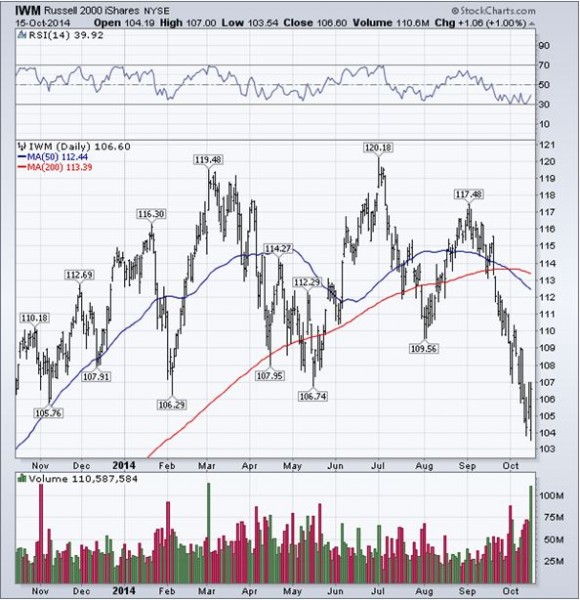
2) Buy US Stocks
The majority of US portfolio managers are still underweight stocks and are desperately trying to get in. Now that the 10% correction is finally behind us, they can afford the luxury of being more aggressive loading up on the dips.
The midterm elections, which saw the Republicans take control of the Senate with a seven seat gain, is a new turbocharger for equities. Congress is now seen as pro business. Since the stock market tripled and corporate profits rocketed with an anti business elected body, imagine how well they will do with a friendly one!
I was hoping for the Senate results to get tied up in runoffs and the courts for a couple of months, triggering a 5% market correction and an opportunity to load the boat once more. It was not to be. What is left for us now is to see the (SPX) grind up to close the year at a 2100 all time high.
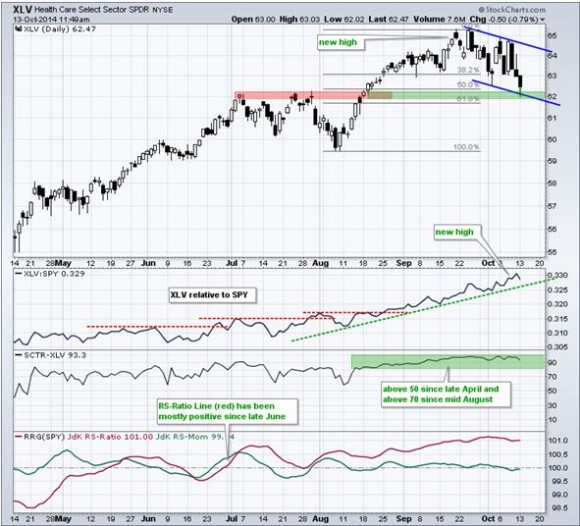
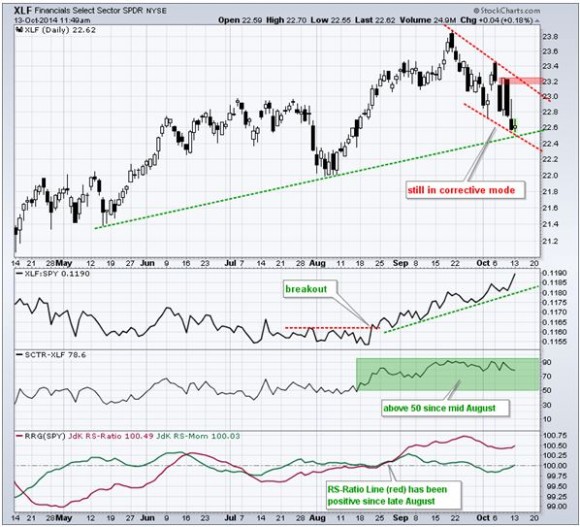
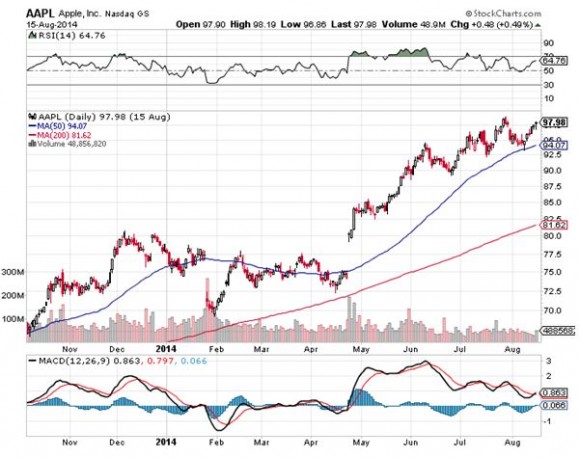
Who will be the sector leaders? The usual suspects who have led the charge all year, technology, health care, and financials.
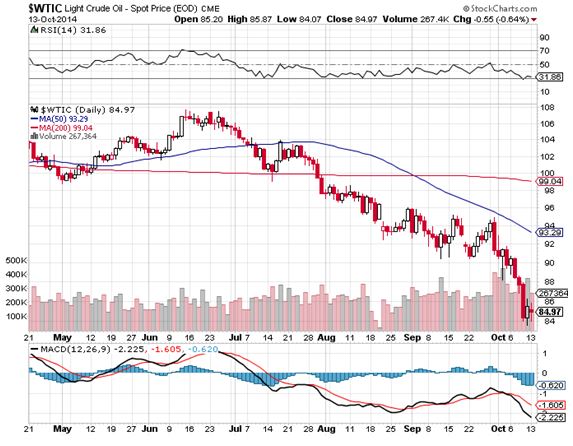
3) Sell Short All Commodities
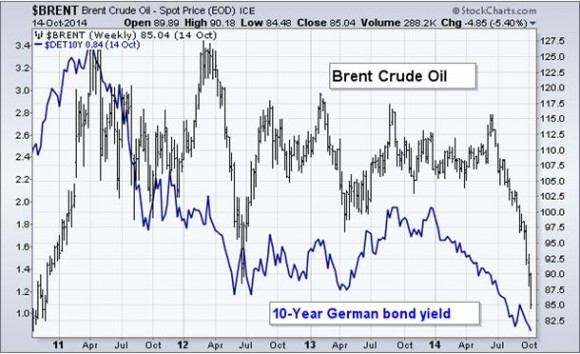
It is truly impressive to see the entire commodity space collapse all at the same time. This includes oil, natural gas, gold, silver, copper, corn, wheat, soybeans, and the commodity producing currencies of the Australian and Canadian dollars.
They have all been hard hit with a perfect storm; overwhelming supply of product, a strong dollar, and weak demand caused by a slowing global economy. The story is the same everywhere.
Commodity collapses always last longer and deeper than you imagine possible because you cannot turn off production by simply flipping a switch, as you can with the paper assets of stocks and bonds. Cutting off supplies means freezing capital spending worth hundreds of billions of dollars spread over decades, no easy task.
So, before you purchase a hard asset of any kind, lie down and take a long nap first. And please stop emailing me asking if this is the bottom for all of the above. It isn?t.
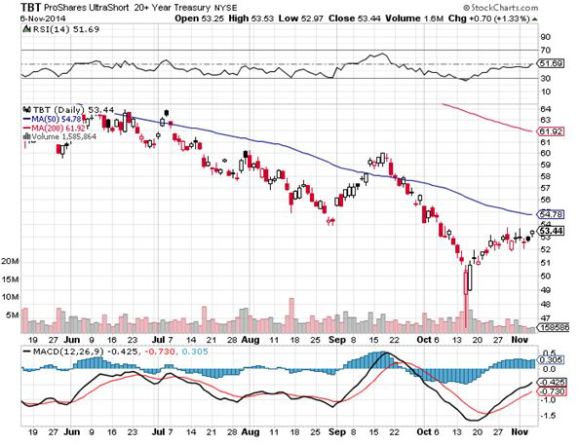
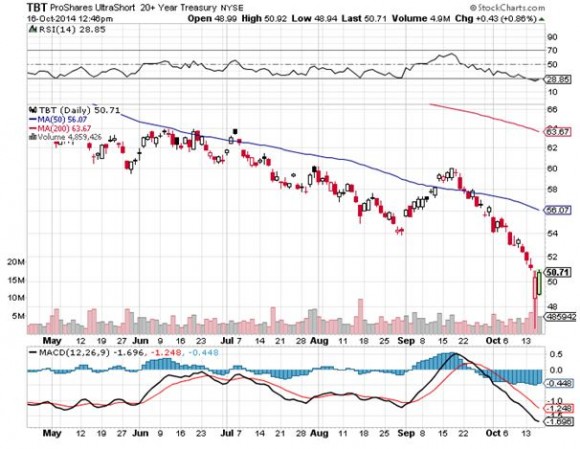
4) Sell All Bonds
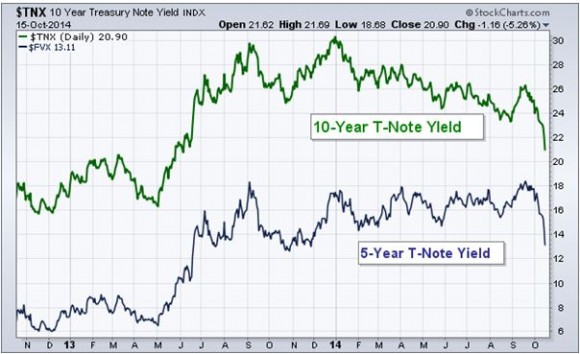
There is a fourth secular trend that began exactly on October 15, right after the market opening. The ten year Treasury bond (TLT) hit a yield of 1.86%. This is a secondary low in yields, high in prices, after the 1.39% yield we saw in 2012. This means we are now two years into a 30-year bear market for all fixed income securities.
However, don?t expect a crash like we saw during the 1970?s, when yields soared up to 13%. Expect a slow grind up in interest rates, often spending 3-6 months in tedious, narrow, sleep inducing ranges.
This makes your entry points on the short side important. Only buy the short Treasury bond ETF (TBT) on substantial dips, lest hair starts growing on the position.
There is one other alternative if you have been following the Trade Alerts of the Mad Hedge Fund Trader all year.
Quit trading and take the rest of the year off. Start your Christmas shopping early. Contribute to retail sales and the national GDP. You earned it. The 42% profit you have earned so far is of heroic proportions.
https://www.madhedgefundtrader.com/wp-content/uploads/2011/10/johnthomas00.png378251Mad Hedge Fund Traderhttps://madhedgefundtrader.com/wp-content/uploads/2019/05/cropped-mad-hedge-logo-transparent-192x192_f9578834168ba24df3eb53916a12c882.pngMad Hedge Fund Trader2014-11-07 01:04:292014-11-07 01:04:29How to Trade the Rest of 2014
Legal Disclaimer
There is a very high degree of risk involved in trading. Past results are not indicative of future returns. MadHedgeFundTrader.com and all individuals affiliated with this site assume no responsibilities for your trading and investment results. The indicators, strategies, columns, articles and all other features are for educational purposes only and should not be construed as investment advice. Information for futures trading observations are obtained from sources believed to be reliable, but we do not warrant its completeness or accuracy, or warrant any results from the use of the information. Your use of the trading observations is entirely at your own risk and it is your sole responsibility to evaluate the accuracy, completeness and usefulness of the information. You must assess the risk of any trade with your broker and make your own independent decisions regarding any securities mentioned herein. Affiliates of MadHedgeFundTrader.com may have a position or effect transactions in the securities described herein (or options thereon) and/or otherwise employ trading strategies that may be consistent or inconsistent with the provided strategies.
We may request cookies to be set on your device. We use cookies to let us know when you visit our websites, how you interact with us, to enrich your user experience, and to customize your relationship with our website.
Click on the different category headings to find out more. You can also change some of your preferences. Note that blocking some types of cookies may impact your experience on our websites and the services we are able to offer.
Essential Website Cookies
These cookies are strictly necessary to provide you with services available through our website and to use some of its features.
Because these cookies are strictly necessary to deliver the website, refuseing them will have impact how our site functions. You always can block or delete cookies by changing your browser settings and force blocking all cookies on this website. But this will always prompt you to accept/refuse cookies when revisiting our site.
We fully respect if you want to refuse cookies but to avoid asking you again and again kindly allow us to store a cookie for that. You are free to opt out any time or opt in for other cookies to get a better experience. If you refuse cookies we will remove all set cookies in our domain.
We provide you with a list of stored cookies on your computer in our domain so you can check what we stored. Due to security reasons we are not able to show or modify cookies from other domains. You can check these in your browser security settings.
Google Analytics Cookies
These cookies collect information that is used either in aggregate form to help us understand how our website is being used or how effective our marketing campaigns are, or to help us customize our website and application for you in order to enhance your experience.
If you do not want that we track your visist to our site you can disable tracking in your browser here:
Other external services
We also use different external services like Google Webfonts, Google Maps, and external Video providers. Since these providers may collect personal data like your IP address we allow you to block them here. Please be aware that this might heavily reduce the functionality and appearance of our site. Changes will take effect once you reload the page.