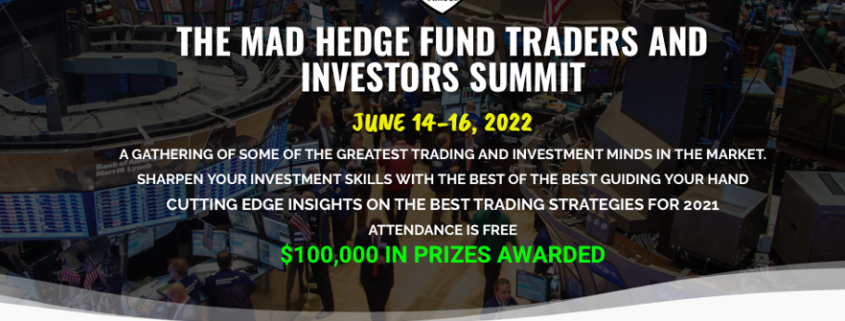
The Mad Hedge Traders & Investors Summit is onfor June 14-16. A collection of the 27 best traders and managers in the world, or eight a day, each giving an educational webinar. Back-to-back one-hour presentations are followed by an interactive Q&A. It’s a smorgasbord of trading strategies, so pick the one that is right for you. Covering all stocks, bonds, commodities, foreign exchange, precious metals, energy, bitcoin, and real estate. It’s the best look at the rest of 2022’s money-making opportunities you will get anywhere. Oh, and you will have a chance to win $100,000 in prizes. To view the schedule and speakers and to register NOW, click here.
https://www.madhedgefundtrader.com/wp-content/uploads/2022/06/mhft-summit-june2022.png664882Mad Hedge Fund Traderhttps://madhedgefundtrader.com/wp-content/uploads/2019/05/cropped-mad-hedge-logo-transparent-192x192_f9578834168ba24df3eb53916a12c882.pngMad Hedge Fund Trader2022-06-14 08:04:112022-06-14 08:26:54The Mad Hedge Traders & Investors Summit is on for June 14-16.
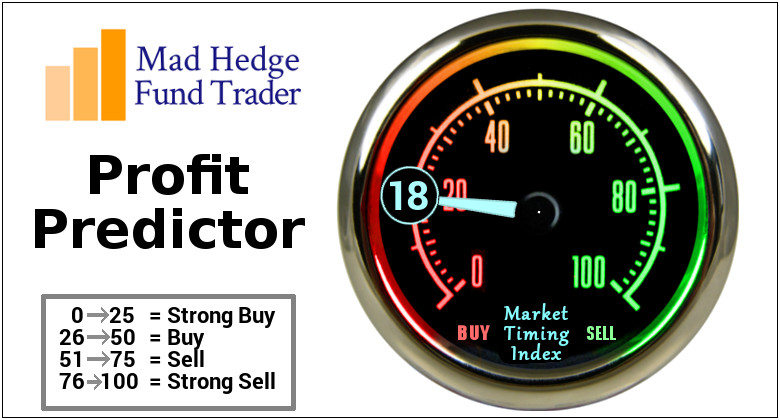
Of course, I am talking about the Federal Reserve.
The Fed was the best friend of share owners, pressing interest rates lower from March 2009. That remained the case for 12 years until November 2021 when its notorious pivot took place, flipping overnight from an easing to a tightening posture.
It's actually worst than that. In fact, our nation’s central bank morphed overnight from the easiest monetary policy in history to the most aggressive tightening.
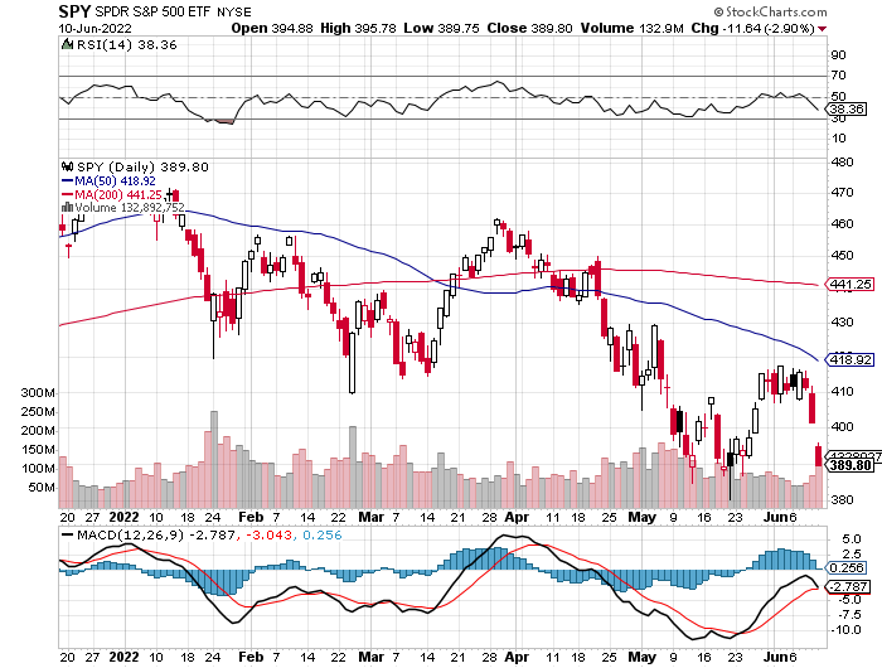
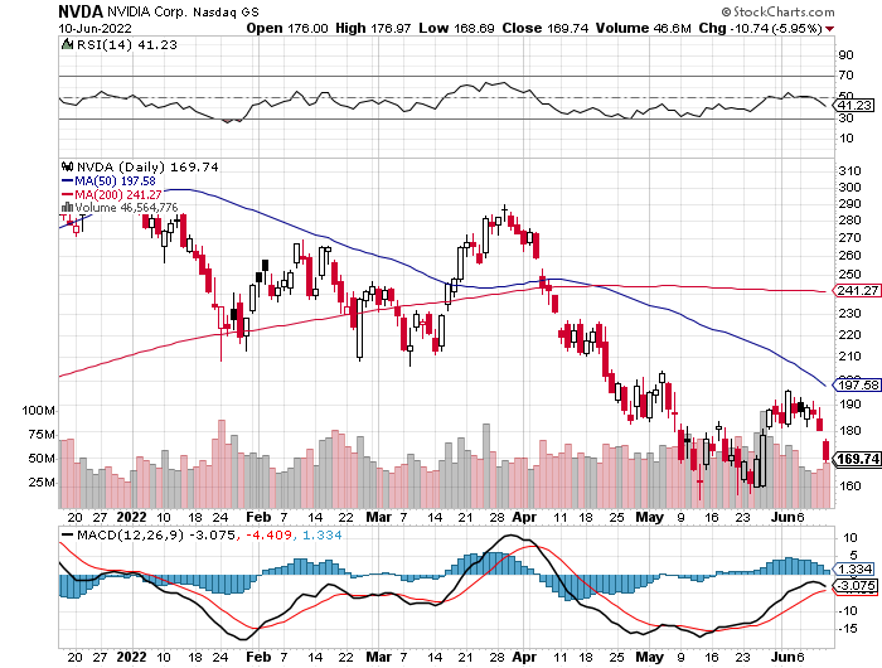
Stock markets have noticed, the Dow average giving up 20% in six months, and the final lows are probably not in yet.
I would bet money that you are expecting the worst-case scenario to happen. After all, the last serious selloff in 2008-2009 took the index down a heart-palpitating 52%.
What’s more, every oil shock of the last 50 years was followed by a recession, and we are clearly in one now. So, you are right to fear for your net worth and retirement security.
However, my work suggests that the best-case scenario will happen. Who is right, you or me?
You already know the answer.
Let me tell you what is already priced in the stock market: a Russian invasion of Ukraine, inflation at a 40-year high and climbing, a doubling of mortgage interest rates in a half year, peaking of the housing bubble, popping of technology and Bitcoin bubbles, and 200 basis points of Fed interest rate hikes.
With all this negativity already in the market, I would say that it is impossible for stocks NOT to go up. All that is left is to suck in one last round of non-believers on the short side before the indexes start a move to new all-time highs. That could take months at the most.
The only question now is whether a further 5% decline to an S&P 500 of 3,600, or a final puke out low of 3,500, down 7.5%. That means you should start scaling into your favorite longs now, the Cadillacs at Volkswagen prices.
So, let’s do some thinking outside the box here.
Tech stocks are cheaper now than after the low point of the Great 2000 Dotcom Bust. But they are still expensive compared to the main market. The S&P without technology stocks is now valued at earnings multiple of 13X versus 17x main market.
That is well into decade-low territory. That’s why I have included financials like (JPM), (BAC), and (C) in my list of “must own sectors'.
It's clear that inflation will bedevil the market for months to come given the dramatic acceleration we saw in May, from 0.3% to 1%. Let me tell you that there are only two ways to end inflation, and they could be done overnight.
*End all US support for Ukraine and throw in with Vladimir Putin. That would shave $50 off the price of oil immediately and get gas prices below $3.00 a gallon. You might have a hard time selling this to the thousands of Americans going over to Ukraine to volunteer.
*Cause a sharp recession immediately. The Fed is already well on their way to doing this with three guaranteed 50 basis point rate hikes by September. The first thing to collapse in a recession is oil demand. In the last recession, it went to negative $37 in the futures market (I got stopped out at -$5). This is why the oil industry isn’t interested in investing a dime at these oil prices. They are responsible to their shareholders, not Biden’s reelection prospects.
If there is a recession, it’s an invisible one. It’s a recession where you can’t hire anyone, can’t buy anything, subcontractors give you a six-month timeline with a straight face, and it takes a year to get delivery of a damn sofa. This recession miserably fails my “look out the window test.”
But at my advanced age, I don’t get surprised anymore.
Boba tea anyone? Who knew?
Consumer Price Index slaughters stocks, taking the Dow Average down 1,600 points, or 5% in two days, the worst move in two years. It’s typical bear market action. May inflation hit 8.6%, a new 40-year high. But you have to more than double to hit the old 1980s peak. New stock lows are in easy reach.
Lumber crashes, down 50% from the highs in months, with the near-complete cessation of new orders from builders. They see a recession just around the corner with higher interest rates and no new home buyers. It’s proof that the current inflation is spiking and setting up for a big fall.
Luxury Home Sales are plunging in New York, in numbers, but not in prices. Anyone who needed debt to trade up is out of the picture.
US drop Covid Testing Requirement for international travelers. Too many Americans trying to get home were getting stranded overseas for weeks because they failed a Covid test. Wheww!! That was a close call!
Americans will spend an extra $730 Billion on energy this year. That’s a heck of a lot to take out of consumer spending. So far, there has been no decline in demand. Much of this money ended up in Russian coffers.
Amazon (AMZN) splits 20:1, triggering an avalanche of new retail buyers. The company is also at the low end of its valuation range anger a gut-punching 41% decline in the share price this year. It may be early, but (AMZN) is definitely a BUY.
Target (TGT) warns of more margin squeeze, with too much inventory and flagging demand. (TGT) has become a bellwether for all of retail, which points to inflation, labor, and supply chain problems.
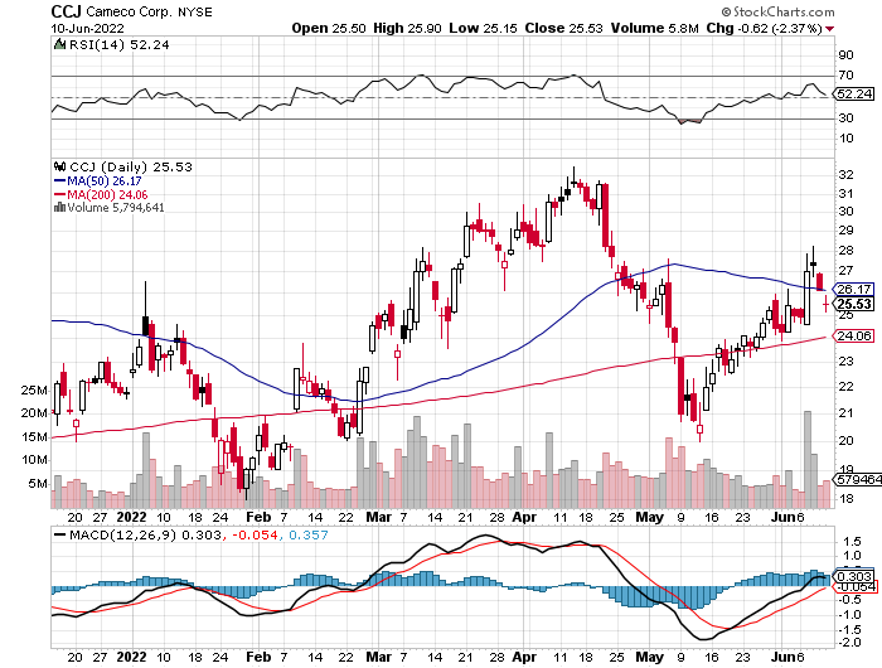
Uranium Stocks soar on Biden’s plan to buy $4.3 billion worth of enriched uranium, or yellow cake. The move is aimed to replace Russian imports where Russia is one of the world’s largest suppliers. It is the most unexploited form of non-carbon energy out there. Mad Hedge recommended Cameco (CCJ), the world’s second-largest supplier, a month ago. It was up 15% yesterday at the high.
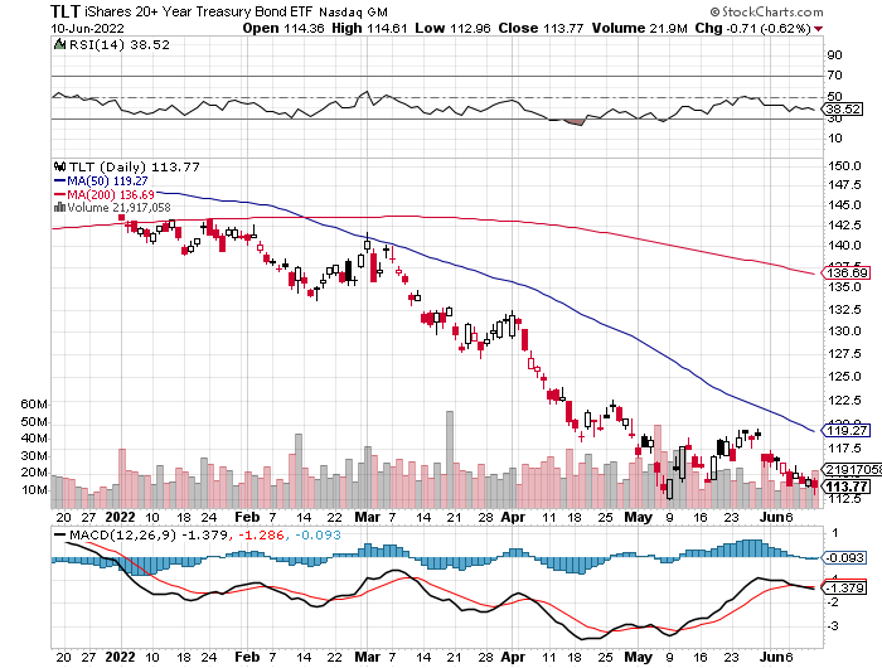
New Home Mortgages hit a 22-year low. With 30-year fixed-rate loans soaring from 2.8% to 5.58% in six months, how can they not? Refis have crashed 75% YOY. Now that the Fed has quit buying, investors won’t touch mortgage-backed securities with a ten-foot pole.
Weekly Jobless Claims pop 29,000 to a five-month high in another hint toward a recession. Continuing Claims are at 1.306 million. The preemptive layoffs by ultra-cautious companies have begun, especially in technology.
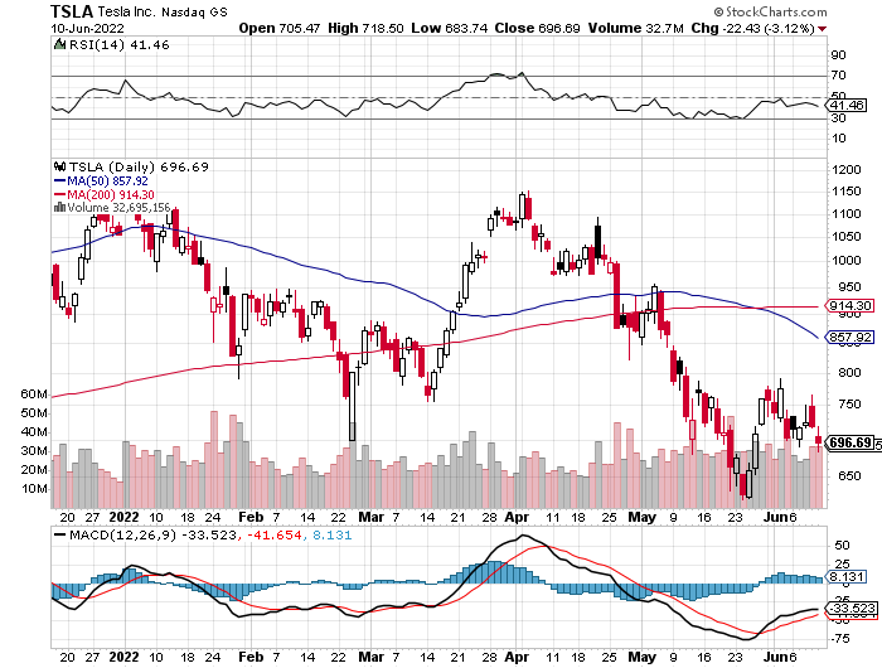
Tesla (TSLA) gets an upgrade by UBS, which sees 51% of upside from here to $1,200. Total sales should top 1.4 million vehicles in 2022, up 40% YOY, and that includes lost production of 60,000 in Shanghai. A new Gigafactory in Indonesia is planned with a locked-up supply of Nickel, where the world’s largest supply of the metal resides. Cheap labor helps a lot where 5,000 need to be hired. The company will need six gigafactories to reach 20 million annual production.
My Ten-Year View
When we come out the other side of pandemic, we will be perfectly poised to launch into my new American Golden Age, or the next Roaring Twenties. With interest rates still historically cheap, oil peaking out soon, and technology hyper-accelerating, there will be no reason not to. The Dow Average will rise by 800% to 240,000 or more in the coming decade. The America coming out the other side of the pandemic will be far more efficient and profitable than the old. Dow 240,000 here we come!
With some of the greatest market volatility seen since 1987, my June month-to-date performance recovered to +2.57%.
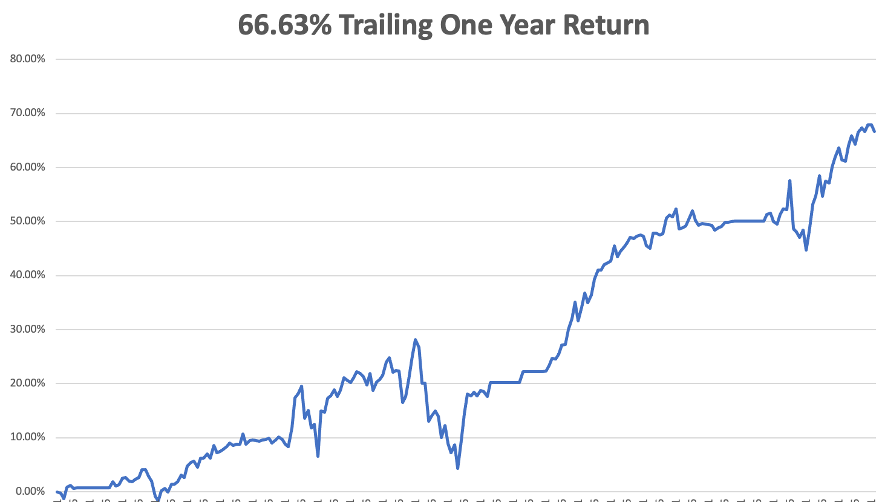
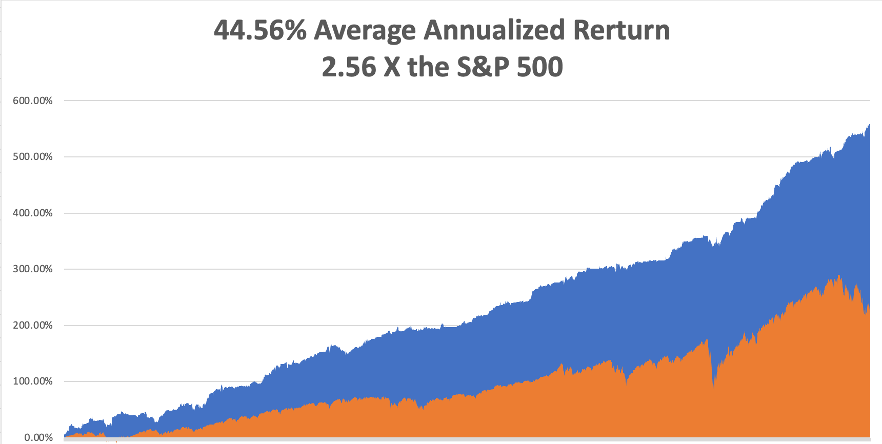
My 2022 year-to-date performance ratcheted up to 44.44%, a new all-time high. The Dow Average is down -13.52% so far in 2022. It is the greatest outperformance on an index since Mad Hedge Fund Trader started 14 years ago. My trailing one-year return maintains a sky-high 66.63%.
That brings my 14-year total return to 557%, some 2.56 times the S&P 500 (SPX) over the same period and a new all-time high. My average annualized return has ratcheted up to 44.56%, easily the highest in the industry.
We need to keep an eye on the number of US Coronavirus cases at 85.6 million, up 200,000 in a week, and deaths topping 1,011,200 and have only increased by 2,000 in the past week. You can find the data here.
On Monday, June 13 at 8:00 AM EDT, US Consumer Inflation Expectations are out. On Tuesday, June 14 at 8:30 AM, the Producer Price Index for May is published.
On Wednesday, June 15 at 10:30 AM, Retails Sales for May are announced. The Fed interest rates decision is out at 11:00 AM. The press conference follows at 11:30. On Thursday, June 16 at 8:30 AM, Weekly Jobless Claims are out. We also get Housing Starts and Building Permits for May.
On Friday, June 10 at 8:15 AM, Industrial Production for May is published. At 2:00, the Baker Hughes Oil Rig Count is out.
As for me, I have benefited from many mentors and role models over the years, but Al Pinder, last of the New York-based Shipping and Trade News, is one of my favorites. Short with blown hair, glasses, and an always impish smile, he was a regular at lunch where we always played an old dice game called “ballout.”
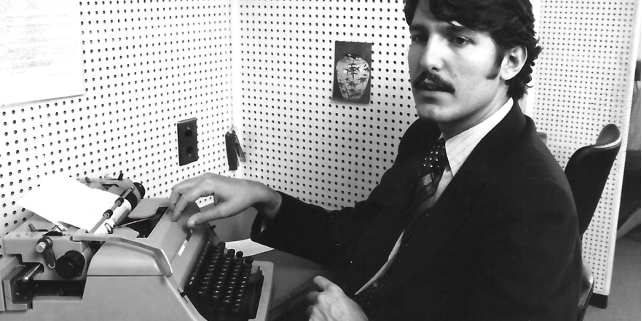
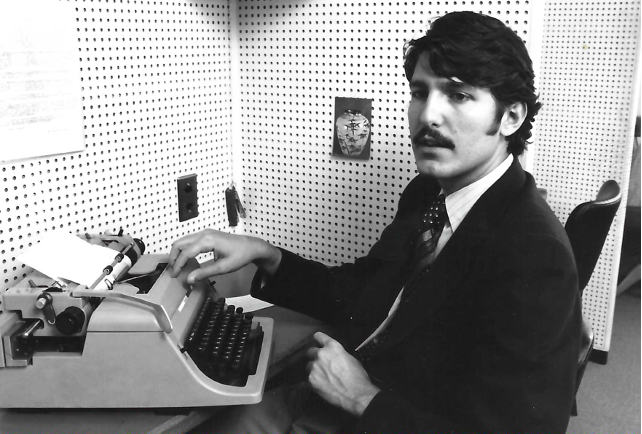
I sat next to Al for ten years at the Foreign Correspondents Club of Japan high up in Tokyo’s Yukakucho Denki Building, we were pounding away on our antiquated Royal typewriters. At the end of the day, our necks would be stiff as boards. Al’s idea of work was to type for five minutes, then tell me stories for ten.
Saying that Al lived a colorful life would be the understatement of the century.
Al covered the Japanese invasion of China during the 1930s, interviewing several key generals like Hideki Tojo and Masaharu Homma, later executed for war crimes. He told me of child laborers in Shanghai silk processors who picked cocoons out of boiling water with their bare hands.
Al could see war with Japan on the horizon, so he took an extended tour of every west-facing beach in Japan during the summer of 1941, taking thousands of black and white pictures. The trick was how to get them out of the country without being arrested as a spy.
So he bought an immense steamer trunk and visited a sex shop in Tokyo’s red-light district where he bought a life-sized, blow-up doll of a Japanese female. His immensely valuable photos were hidden below a false bottom in the trunk and the blow-up doll placed on top.
When he passed through Japanese customs on the ship home from Yokohama, the inspectors opened the trunk, had a good laugh, and then closed it. These photos later became the basis of Operation Coronet, the American invasion of Japan in 1945.
Al was working for the Honolulu Star Bulletin when the Japanese attacked Pearl Harbor on December 7, 1941. Many antiaircraft shells fired at the attacking zeros landed in Honolulu causing dozens of casualties. Al told me every woman on the island wanted to get laid that night because they feared getting raped by the Japanese Army the next day.
Since Al knew China well, he was parachuted into western Yunan province to act as a liaison with Mao Zedong, then fighting a guerrilla war against the Japanese with his Eighth Route Army. Capture by the Japanese then meant certain torture and certain death.
In 1944, Al received a coded message in Morse code to pick up an urgent communication from Washington. So, he hiked a day to the drop zone and when the Army Air Corps DC-3 approached, he lit three signal fires.
A package parachuted to the ground, which he grabbed and then he fled for the mountains. Dodging enemy patrols all the way, he returned to his hideout in a mountain cave and opened the package. It was a letter from the Internal Revenue Service asking why he had not filed a tax return in three years.
When the second atomic bomb fell on Nagasaki, the war ended on August 15. Since Al was the closest man on the spot, he flew to Korea where he accepted the Japanese surrender there.
Al was one of the first to move into the Press Club, which housed war correspondents in one of the only buildings still standing in a city that had been bombed flat.
Al never left Japan because, as with many other war correspondents who arrived with the US military, it was the best thing that ever happened to him. After some initial hesitation, they were treated like conquering heroes, it was incredibly cheap at 800 yen to the dollar, and the women were beautiful.
During the Japanese occupation when the people were starving, Al bought an acre of land in Tokyo’s burned-out prime Akasaka district for a ten-pound can of ham. He spent the rest of his life living off this investment, selling one piece at a time, until it eventually became worth $10 million.
Al went to work for the Shipping and Trade News, an obscure industry trade publication which no one had ever heard of. I sat next to him when he artfully lifted every story out of an ancient book, Ships of the World. But Al always had plenty of money to spend.
When Al passed away in the early 2000s, an official from the American embassy in Tokyo showed up at the Press Club asking if anyone knew all Pinder. We eventually traced a bank branch which held a safe deposit box in his name. In it was proof that the CIA had been bribing every Japanese prime minister of the 1950s. He kept the evidence as an insurance policy against the day when his lucrative deal with the Shipping and Trade News was ever put at risk.
I flew in for Al’s wake and his Japanese wife was there along with most of the foreign press. Everyone was crying until I told the IRS story, then they had a good laugh.
A few years ago, I was invited to give the graduation speech at Defense Language Institute in Monterey, California. The latest bunch of graduates, including my nephew, were freshly versed in Arabic and headed for the Middle East.
The school was founded in 1941 to train Americans in Japanese to gain an intelligence advantage in the Pacific war.
General 'Vinegar Joe' Stillwell said their contribution shortened the war by two years. General Douglas MacArthur believed that an army had never before gone to war with so much advance knowledge about its enemy.
To this day, the school's motto is 'Yankee Samurai'. There on the wall with the school’s first graduates was a very young Al Pinder, still with that impish grin.
Al lived a full life and I still miss him to this day. I hope I can do as well.
Stay Healthy,
John Thomas
CEO & Publisher
The Diary of a Mad Hedge Fund Trader
Al Pinder
Press Club 1976
https://www.madhedgefundtrader.com/wp-content/uploads/2022/06/john-thomas-press-club-1976.png434642Mad Hedge Fund Traderhttps://madhedgefundtrader.com/wp-content/uploads/2019/05/cropped-mad-hedge-logo-transparent-192x192_f9578834168ba24df3eb53916a12c882.pngMad Hedge Fund Trader2022-06-14 08:02:382022-06-14 08:27:59The Market Outlook for the Week Ahead, or What Happens When Your Best Friend Becomes You Worst Enemy
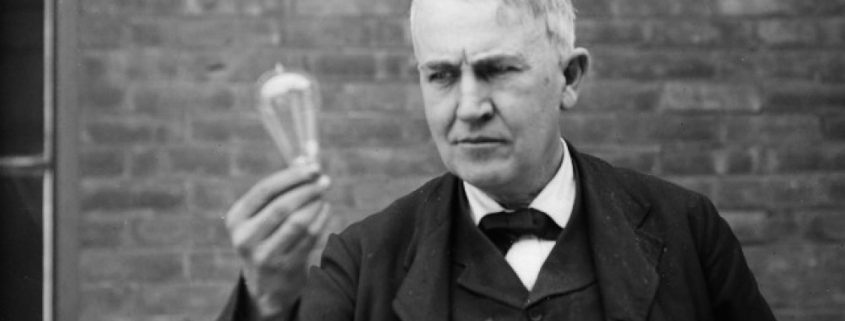
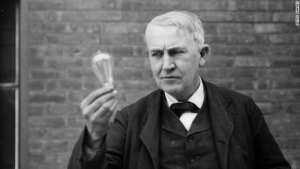
“I have not failed, I have just found 10,000 ways that do not work,” said the inventor, Thomas Edison.
https://www.madhedgefundtrader.com/wp-content/uploads/2018/09/Thomas-Edison-e1537471324234.jpg169300MHFTRhttps://madhedgefundtrader.com/wp-content/uploads/2019/05/cropped-mad-hedge-logo-transparent-192x192_f9578834168ba24df3eb53916a12c882.pngMHFTR2022-06-14 08:00:082022-06-14 08:32:55June 14, 2022 - Quote of the Day
The biweekly strategy webinar scheduled for June 15 has been postponed until 12:00 PM EST on June 22. I will have my hands full hosting the Mad Hedge Traders & Investors Summit this week, which I hope you all attend.
I look forward to hearing from you again next week.
John Thomas
CEO & Publisher
Diary of a Mad Hedge Fund Trader
https://www.madhedgefundtrader.com/wp-content/uploads/2020/05/mr-john-thomas-1-e1595422688475.png567450Mad Hedge Fund Traderhttps://madhedgefundtrader.com/wp-content/uploads/2019/05/cropped-mad-hedge-logo-transparent-192x192_f9578834168ba24df3eb53916a12c882.pngMad Hedge Fund Trader2022-06-13 11:04:032022-06-13 12:08:53The June 15 Biweekly Strategy Webinar is Postponed
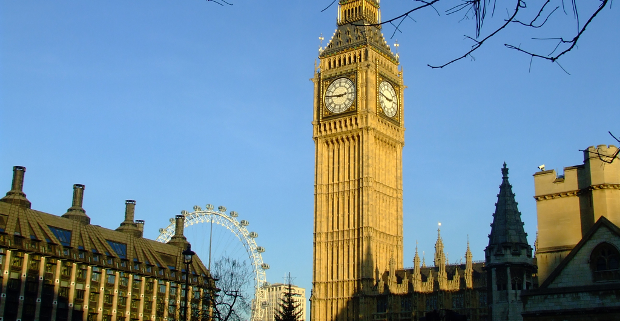
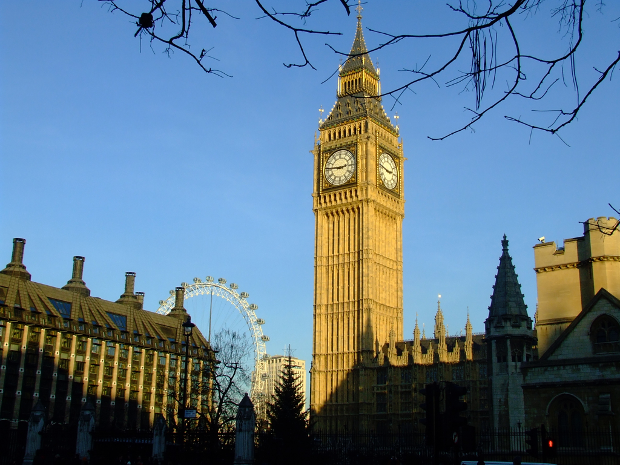
Come join me for lunch for the Mad Hedge Fund Trader’s Global Strategy Update, which I will be conducting in London on Monday, June 29, 2022. A three-course lunch is included. This will be my first London Luncheon in six years.
I’ll be giving you my up-to-date view on stocks, bonds, currencies commodities, precious metals, energy, Bitcoin, and real estate.
And to keep you in suspense, I’ll be throwing a few surprises out there too. Enough charts, tables, graphs, and statistics will be thrown at you to keep your ears ringing for a week. Tickets are available for $329.
The lunch will be held at a private club on St. James Street, the details of which will be emailed to you with your purchase confirmation. I just checked with the club and as of today, masks are not required.
I look forward to meeting you, and thank you for supporting my research.
To purchase tickets for this luncheon, please click here.
https://www.madhedgefundtrader.com/wp-content/uploads/2022/04/London-1.png466620Mad Hedge Fund Traderhttps://madhedgefundtrader.com/wp-content/uploads/2019/05/cropped-mad-hedge-logo-transparent-192x192_f9578834168ba24df3eb53916a12c882.pngMad Hedge Fund Trader2022-06-10 12:04:322024-10-01 18:02:34SOLD OUT - Wednesday, June 29, 2022 London Strategy Luncheon
Due to overwhelming demand from readers, I am going to review the new Tom Cruise movie, Top Gun: Maverick.
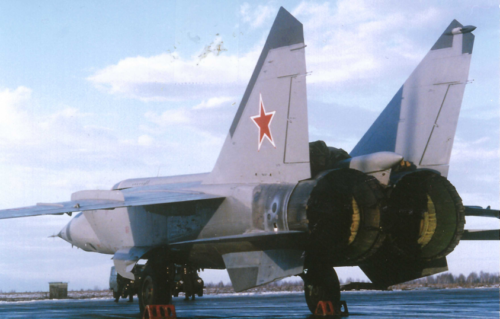
I’m probably the only guy you will ever run into who has flown Mach 2.5 at 90,000 feet, and with 50 years of experience as a combat pilot, it’s safe to say I know my way around a cockpit, all of them.
For a start, they put Top Gun in the wrong state. The Naval Fighter Weapons School moved from North Island, San Diego to far cheaper Fallon Nevada in 1996, where I got my first Covid-19 shot.
But North Island definitely makes a much more scenic backdrop for a romantic backstory, the part where I fell asleep. I know it well and have given many speeches to graduating Top Gun and Naval Seal classes there over the years. You can’t beat those white sand beaches.
Let’s start with the stuff that doesn’t exist. The scramjet that Maverick takes to Mach 10.4 at the beginning of the movie probably won’t fly for another 20 years, it ever. In 2004, an unmanned test of the NASA X-43 scramjet did fly for ten seconds over the Pacific at Mach 10 and then crashed into the ocean.
There is work underway at the Lockheed Skunk Works at Edwards Air Force Base in California (you can see a skunk on the tail of Tom Cruise’s plane), but it’s so secret even I don’t know about it. My friend there, Kelly Johnson, passed away 32 years ago so no more inside tips. When this thing does fly, it will get you from New York to Tokyo in two hours.
The US does have a fifth-generation stealth fighter, the Lockheed Martin F-35 Lightning II that can go up against the Chinese Chengdu J-20 and the Russian Sukhoi-57 and beat them hands down. The F-35 can fly Mach 1.6. The movie implies only the enemy has these advanced planes, forcing our heroes to fly the ever-reliable, but constantly ungraded 44-year-old McDonnel Douglas F/A 18.
It is true that the military will pull old pilots out of retirement for special missions. I am a perfect example. When a pilot joins the military it’s for life and the only way to retire is to die in a crash. Maverick is retrieved from working on a WWII P51 Mustang, which I also fly.
This is because the military never throws anything out and will keep flying planes as long as they can find pilots. Our oldest flying B-52 Stratofortress is 70 years old, is slated to fly for 100 years in total, and was originally designed by Nazi Germany.
I thought the movie did a very accurate representation of high G-forces, which absolutely beat the crap out of you and are fatal above a reading of 10 where your internal organs explode. I have flown G-forces up to 10, and at that pressure, I weighed 2,000 pounds and my arms were so heavy I couldn’t reach the controls. I thought my Russian co-pilot was trying to kill me.
The same is true of the extreme aerobatics in the film, which are exhausting. Sometimes pilots have to be lifted out of their seats after such maneuvers.
Despite these factual transgressions, I enjoyed the movie, even though I spent half the movie saying to myself, “No way.” You can see they had massive support from the Navy and even had Blue Angle pilots flying the aerobatic and combat scenes (Tom Cruise was cut and pasted into the cockpit.) Sure, it was a stretch for them to steal a 52-year-old F-14 swing wing Tomcat and land it on a carrier. This is fiction after all. But it is all about us oldies.
That’s because many of the current Navy leadership were inspired to join by the first Top Gun movie in 1986 in which a much younger Tom Cruise also starred. It became the greatest Navy recruiting device of all time. It’s no surprise the Navy was all over this one like a wet blanket, lending them a squadron on F/A 18’s with real Top Gun pilots. How much did that cost?
Top Gun: Maverick has been far and away the biggest box office blockbuster of 2022 and signaled the return of many moviegoers for the first time since the pandemic. Call it a coming-out party for all of us. A Top Gun Barbie Doll has even hit the stores.
Sure Tom Cruise is getting old (59), but who am I to complain?
A Soviet Mig-29
My Russian Copilot
https://www.madhedgefundtrader.com/wp-content/uploads/2022/06/john-thomas-pilot.png486864Mad Hedge Fund Traderhttps://madhedgefundtrader.com/wp-content/uploads/2019/05/cropped-mad-hedge-logo-transparent-192x192_f9578834168ba24df3eb53916a12c882.pngMad Hedge Fund Trader2022-06-10 12:02:052022-06-10 13:43:48My “Top Gun: Maverick Review”
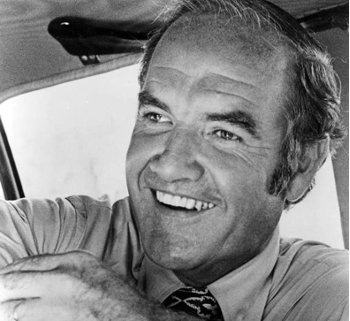
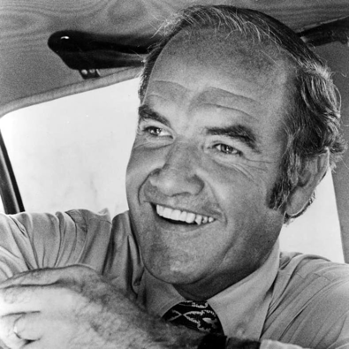
“Altitude above you, runway behind you, and fuel in tanks on the ground are utterly useless,” said presidential candidate George McGovern, a WWII B-24 Liberator pilot.
https://www.madhedgefundtrader.com/wp-content/uploads/2022/06/george-mcgovern.png350350Mad Hedge Fund Traderhttps://madhedgefundtrader.com/wp-content/uploads/2019/05/cropped-mad-hedge-logo-transparent-192x192_f9578834168ba24df3eb53916a12c882.pngMad Hedge Fund Trader2022-06-10 12:00:062022-06-10 13:40:30Quote of the Day - June 10, 2022
Featured Trade: (WHAT THE HECK IS ESG INVESTING?),
(TSLA), (FSLR), (TAN), (MO)
https://madhedgefundtrader.com/wp-content/uploads/2019/05/cropped-mad-hedge-logo-transparent-192x192_f9578834168ba24df3eb53916a12c882.png00Mad Hedge Fund Traderhttps://madhedgefundtrader.com/wp-content/uploads/2019/05/cropped-mad-hedge-logo-transparent-192x192_f9578834168ba24df3eb53916a12c882.pngMad Hedge Fund Trader2022-06-09 10:04:232022-06-09 10:21:57June 9, 2022
Legal Disclaimer
There is a very high degree of risk involved in trading. Past results are not indicative of future returns. MadHedgeFundTrader.com and all individuals affiliated with this site assume no responsibilities for your trading and investment results. The indicators, strategies, columns, articles and all other features are for educational purposes only and should not be construed as investment advice. Information for futures trading observations are obtained from sources believed to be reliable, but we do not warrant its completeness or accuracy, or warrant any results from the use of the information. Your use of the trading observations is entirely at your own risk and it is your sole responsibility to evaluate the accuracy, completeness and usefulness of the information. You must assess the risk of any trade with your broker and make your own independent decisions regarding any securities mentioned herein. Affiliates of MadHedgeFundTrader.com may have a position or effect transactions in the securities described herein (or options thereon) and/or otherwise employ trading strategies that may be consistent or inconsistent with the provided strategies.