Below please find subscribers’ Q&A for the Mad Hedge Fund Trader October 31 Global Strategy Webinar with my guest and co-host Bill Davis of the Mad Day Trader.
As usual, every asset class long and short was covered. You are certainly an inquisitive lot, and keep those questions coming!
Q: I would like to keep CRISPR stocks as a one or two-year-old, or even longer if it is prudent. What do you think?
A: Yes, there is a CRISPR revolution going on in biotech—I’m extremely bullish on all these stocks, like Editas Medicine (EDIT), Thermo Fisher Scientific (TMO), and Ovascience Inc. (OVAS). If any of these individual companies don’t move forward with their own technology, they will get taken over. The principal asset of these companies is not the patents or the products, it’s the staff, and there is an extreme shortage in CRISPR specialists (and anybody who knows anything about monoclonal antibodies).
Q: Could you explain how to manage LEAPs? For example, the Gold (GLD) and the General Electric (GE) LEAPs. Sit and leave them or trade them short term?
A: You make a lot of money trading long-term LEAPs. Just because you own a year and a half LEAP doesn’t mean that you keep it for a year and a half. You sell it on the first big profit, and I happen to know that on both the Gold (GLD) and the (GE) LEAPs we sent out, people made a 50% profit in the first week. So, I told them: sell it, take the profit. The market always gives you another chance to get in and buy them cheap. You make the money on the turnover, on the volume—not hanging out trying to hit a home run.
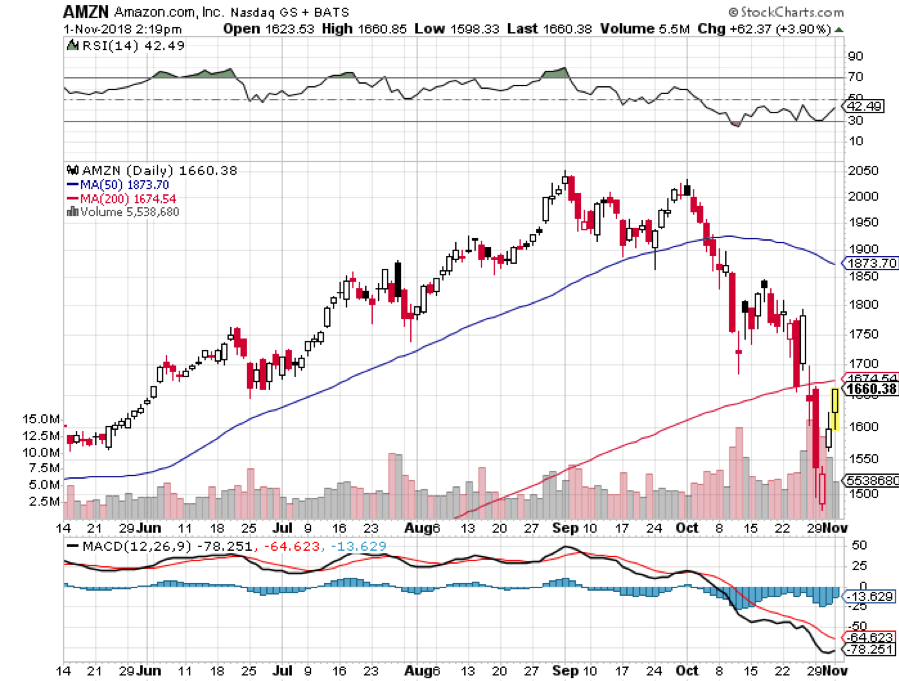
Q: Why did you only close the Amazon (AMZN) November $1,550-$1,600 vertical bull call spread and not roll the strike prices down and out?
A: Well I actually did do the down and out strike roll out first, which is the super aggressive approach. By adding the November $1,350-$1,400 vertical bull call spread position on Monday at the market lows and doubling the size—we took a huge 30% position in Amazon and that position alone should bring in about $3600 in profits in two weeks, at expiration. And when I put on that second position I told myself that on the next big rally I would get out of the high-risk trouble making position, which was the November $1,550-$1,600 vertical bull call spread. So that’s how you trade your way out of a 30% drop in three weeks in one of the best tech stocks in the market.
Q: Is AT&T (T) no longer a good buy at these prices?
A: All of the telephone companies have legacy technology, meaning they are all dying. Basically, AT&T is about owning a bunch of rusting copper wire spread around the country. They haven’t been able to innovate new technologies fast enough to keep up with others who have. The only reason to own this is for the very high 6.56% dividend. That said, dividends can be cut. Look at General Electric which cut its dividend earlier this year. Whatever you make of the dividend can get lost in the principal.
Q: Do you think Square (SQ) is a good buy at this level?
A: Absolutely, it’s a screaming buy. It’s one of the favorite companies of the Mad Hedge Technology Letter and one of the preeminent disruptors of the banks. We think there’s another 400% gain in Square from here. It’s dominating FinTech now.
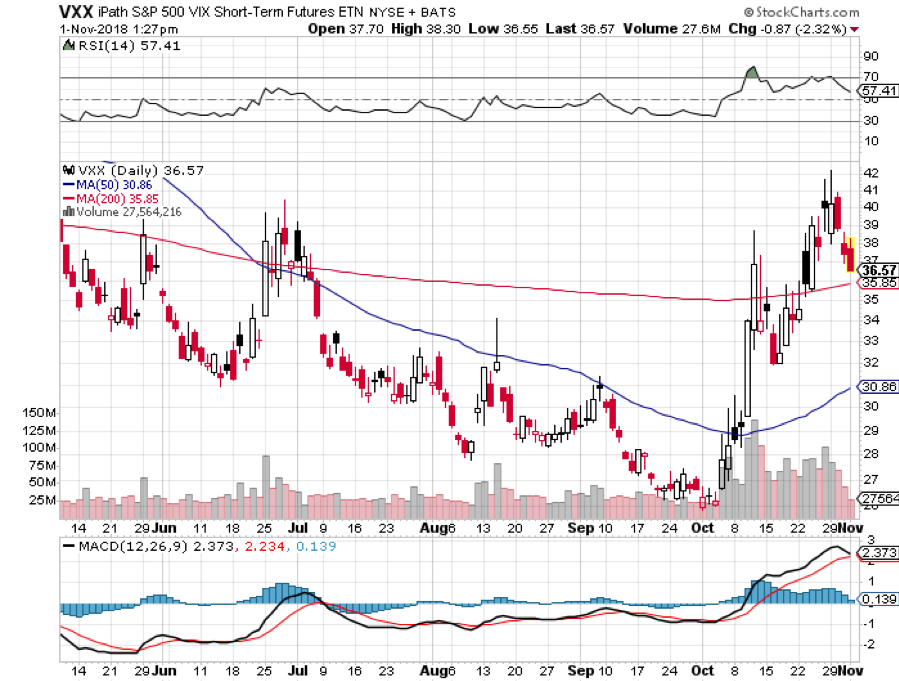
Q: When do you expect to close the short position in the iPath S&P 500 VIX Short-Term Futures ETN (VXX)?
A: If we can get the Volatility Index (VIX) down to $15, the (VXX) should crater. We’ll take a hit on the time decay and that’s why I say we may be able to sell it for 20 cents in the future when this happens. We’ll still take a 50% hit on the position, but half is better than none.
Q: What happened to Microsoft (MSFT) last week?
A: People sold their winners. They had a great earnings report and great long-term earnings prospects, but everyone in the world owned it. Buy the long-term LEAP on this one.
Q: If we want to double up on the iPath S&P 500 VIX Short-Term Futures ETN (VXX), how do you plan to do it?
A: Go out to further with your expiration date. When you go long the (VXX) you only buy the most distant expiration date. I would buy the February 15 expiration as soon as it becomes available.
Q: How do you see Goldman Sachs (GS) from here to the end of the year?
A: It may go up a little bit as we get some index money coming into play for year-end, but not much; I expect banks to continue to underperform. They are no longer a rising interest rate play. They are a destruction by FinTech play.
Q: Is it too soon for emerging markets in India (PIN)?
A: As long as the dollar (UUP) is strong, which is going to be at least another year, you want to avoid emerging markets like the plague. As long as the Federal Reserve keeps raising interest rates, increasing the yield differential with other currencies, the buck keeps going up.
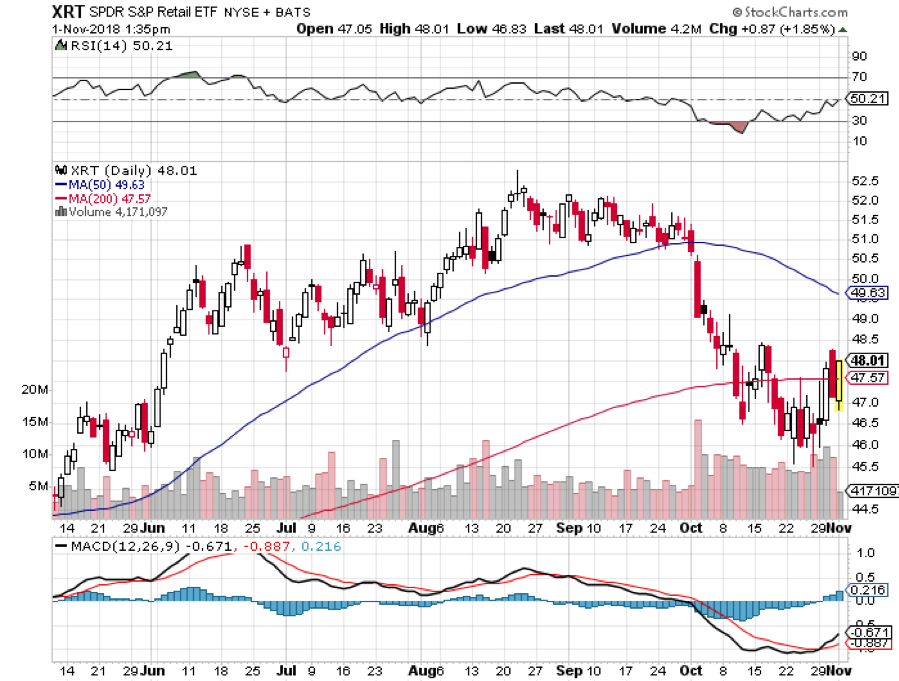
Q: What are your thoughts on retail ETFs like the SPDR S&P Retail ETF (XRT)?
A: You may get lucky and catch a rally on that but the medium term move for retail anything is down. They are all getting Amazoned.
Q: Is it better to increase long exposure the day before the election?
A: No, what we saw starting on Tuesday was the pre-election move. That said, I expect it to continue after the election and into yearend.
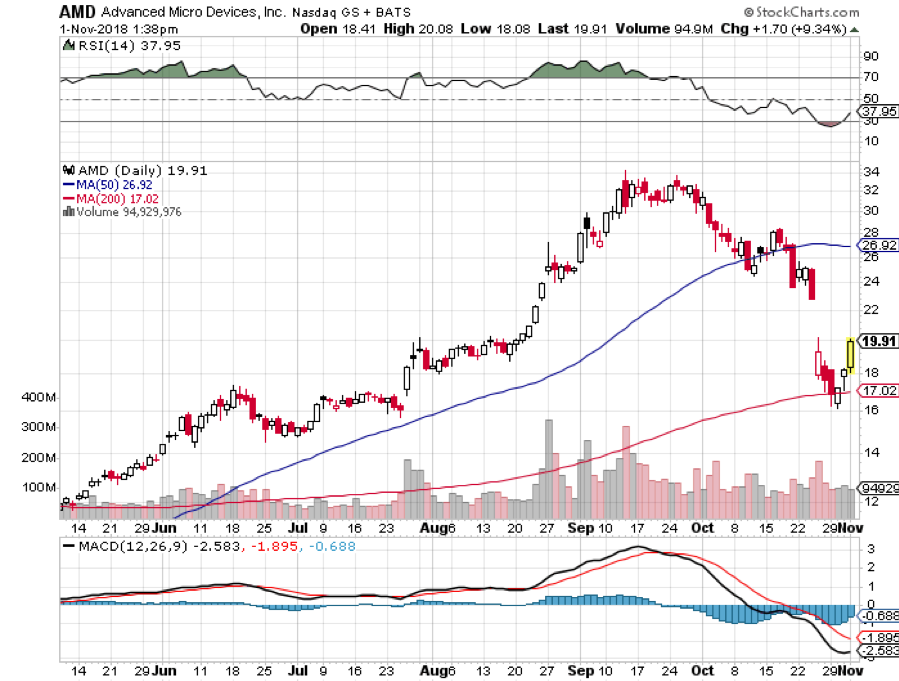
Q: Any opinions on Advanced Micro Devices (AMD)?
A: Yes, this is a great level. It was extremely overbought two months ago but has now dropped 50%. It is a great long-term LEAP candidate.
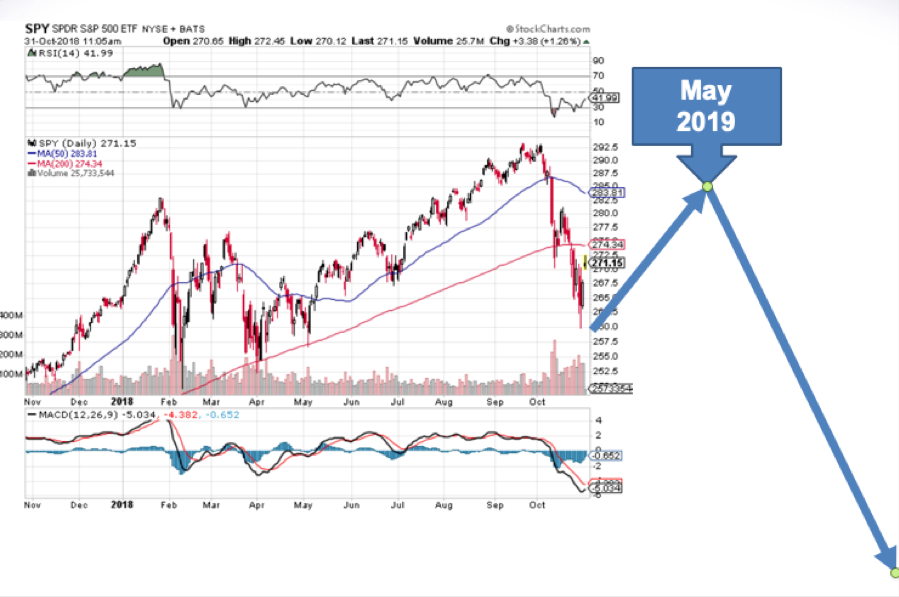
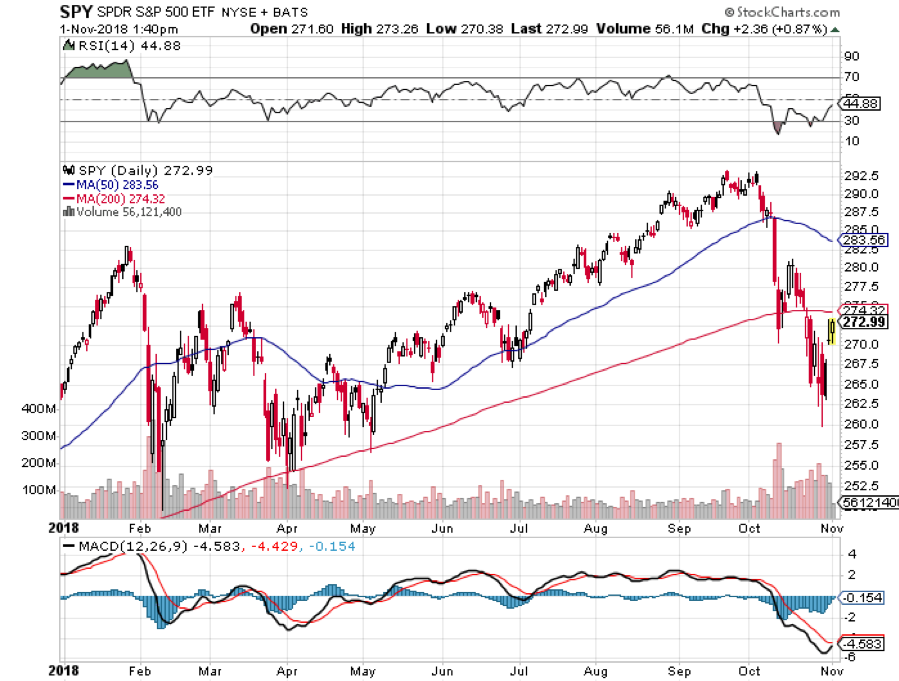
Q: What about the W bottom in the stock market that everyone thinks will happen?
A: I’m one of those people. So far, the bottom for the move in the S&P 500 is looking pretty convincing, but we will test the faith sometime in the next week I’m sure. We got close enough to the February $252 low to make this a very convincing move. It sets up range trading for the market for the next year.
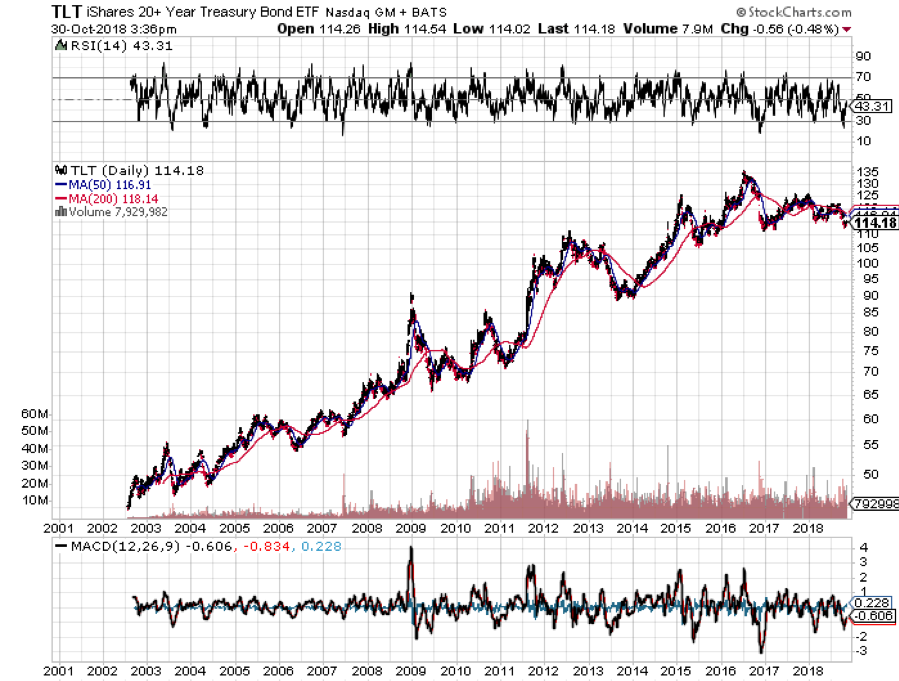
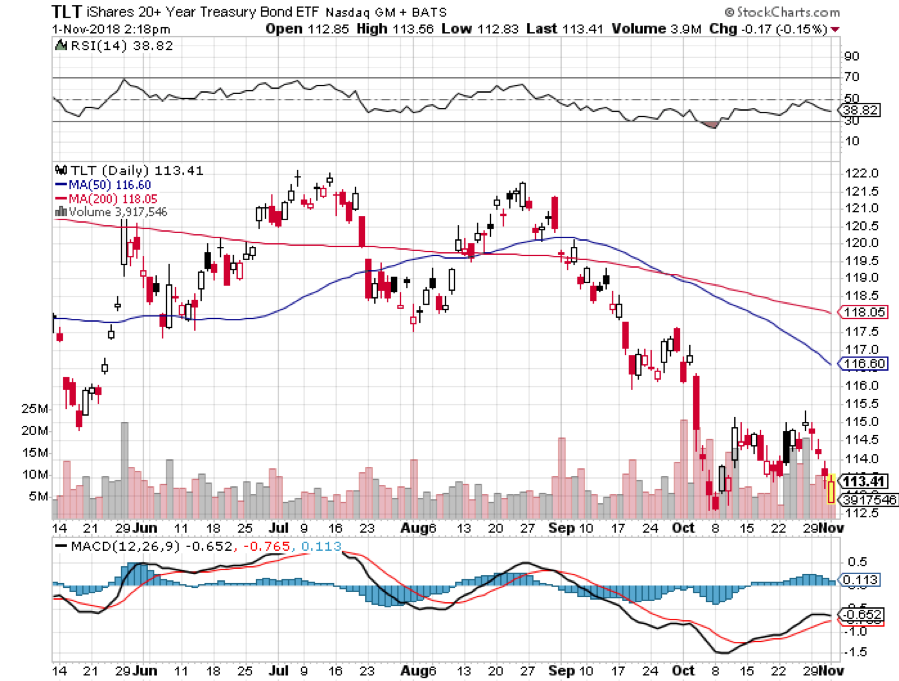
Q: How do you figure the inflation rate is 3.1%?
A: The year-on-year Consumer Price Index for September printed at 2.3%, and the most recent months have been running at an annualized 2.9% rate. Given that this data is months old we are probably seeing 3.1% on a monthly annualized basis now given all the anecdotal evidence of rising prices and wages that are out there. That is certainly what the bond market believes with its recent sharp selloff and why I will continue to be a fantastic short. Sell every United States US Treasury Bond Fund ETF (TLT) rally. Like hockey great Wayne Gretzky said, you have to aim not where the hockey puck is, but where it's going to be.
Q: Will rising interest rates kill the housing market?
A: It already has. A 5% 30-year mortgage rate shuts a lot of first time Millennial buyers out of the market. We are seeing real estate slowing all over the country. Los Angeles is getting the worst hit.
Q: How do you see the Christmas selling season going?
A: It’s going to be great, but this may be the last good one for a while. And Amazon is getting half the business.
Q: October was terrible. How do you see November playing out?
A: It could well be a mirror image of October to the upside. We are already $1,000 Dow points off the bottom. So far, so good. Throw fundamentals out the window and buy whatever has fallen the most….like Amazon.
Did I mention you should buy Amazon?
Good luck and good trading
John Thomas
CEO & Publisher
The Diary of a Mad Hedge Fund Trader
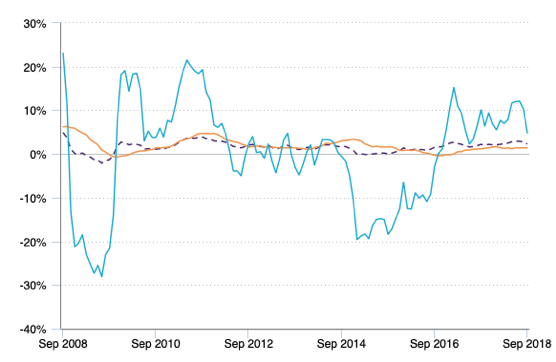
Ten Years of Consumer Price Index