Featured Trade: (FEBRUARY 12 AUCKLAND NEW ZEALND STRATEGY LUNCH) (THE PRICE OF STARDOM AT DAVOS), (WILL GOLD COINS SUFFER THE FATE OF THE $10,000 BILL), (GLD), (SIGN UP NOW FOR TEXT MESSAGING OF TRADE ALERTS)
SPDR Gold Shares (GLD)
https://madhedgefundtrader.com/wp-content/uploads/2019/05/cropped-mad-hedge-logo-transparent-192x192_f9578834168ba24df3eb53916a12c882.png00Mad Hedge Fund Traderhttps://madhedgefundtrader.com/wp-content/uploads/2019/05/cropped-mad-hedge-logo-transparent-192x192_f9578834168ba24df3eb53916a12c882.pngMad Hedge Fund Trader2014-01-27 01:07:212014-01-27 01:07:21January 27, 2014
Featured Trade: (SATURDAY FEBRUARY 22 BRISBANE AUSTRALIA STRATEGY LUNCH) (A FEW THOUGHTS ON TRADING STRATEGY), (SPY), (QQQ), (IWM), (GLD), (GDX), (ABX), (TLT), (TBT), (ANOTHER DINNER WITH ROBERT REICH)
SPDR S&P 500 (SPY)
PowerShares QQQ (QQQ)
iShares Russell 2000 (IWM)
SPDR Gold Shares (GLD)
Market Vectors Gold Miners ETF (GDX)
Barrick Gold Corporation (ABX)
iShares 20+ Year Treasury Bond (TLT)
ProShares UltraShort 20+ Year Treasury (TBT)
https://madhedgefundtrader.com/wp-content/uploads/2019/05/cropped-mad-hedge-logo-transparent-192x192_f9578834168ba24df3eb53916a12c882.png00Mad Hedge Fund Traderhttps://madhedgefundtrader.com/wp-content/uploads/2019/05/cropped-mad-hedge-logo-transparent-192x192_f9578834168ba24df3eb53916a12c882.pngMad Hedge Fund Trader2014-01-24 01:06:492014-01-24 01:06:49January 24, 2014
I never tire of listening to economics guru, Robert Reich, speak about the economy. He was former Labor Secretary under Bill Clinton, and ran against Mitt Romney for governor of Massachusetts (he lost). He has published 13 books. Oh, and he dated our recent Secretary of State, Hillary Rodham, when they were in law school together at Yale.
I got to know Bob well when I took two of his courses at UC Berkeley, on public policy and labor statistics. His insights into the long-term evolution of the US economy are nothing less than breathtaking. New students are ordered to the bookstore to buy 400 pages of photocopied jobs data, which they must commit to memory. And he is damn funny.
Not everything Bob has to say makes pleasant listening. The central challenges for the economy are jobs and wages, not deficits or inflation. A rush to trim spending too fast unnecessarily robs the economy of growth. Look no further than Europe, where ill advised and ideologically driven austerity policies have led to near economic collapse. If similar policies are implemented here, they will no doubt bring the same result.
Past economic recoveries brought far more dramatic snap backs. After the 1929 crash, the GDP fell a staggering 28% over the following three years. Then in 1934 it bounced back by 8%, in 1935, by 8%, and 1936 by 10%. The stock market recovered two thirds of its losses. That compares to today?s tepid 2% growth rate.
Then in 1937, a rush to end stimulus prematurely sent the country into the second leg of the Great Depression. That didn?t end until 1942. Stocks fell again by half. The big question for us today is whether 2014 will be a replay of 1937.
All middle class coping mechanisms to deal with falling incomes have been exhausted. First, women entered the workforce during the seventies to offset spouses? declining wages. Then both began working longer hours. Today, Americans work 300 hours a year longer than Europeans and Japanese.
Finally, they turned to the home ATM in desperation during the nineties and 2000?s to make ends meet. Those cash machines abruptly shut down in 2008. Today, families have no resources left to maintain standards of living. This is why there has been no growth in the American median wage for 30 years. The declining consumer spending these trends inevitably produced our present slow growth economy.
There were two turbochargers that assured the downfall would be as dramatic as it has been. Globalization suddenly meant that the $75/ hour blue-collar worker was competing head to head against a $2/day Chinese wage slaves. The Internet made this face off practical.
Technology also created robots to replace workers on an enormous scale. Bob like to tell the story of an invitation he received to speak at a much-publicized factory reopening in the Midwest. When he took the tour, he found only 13 workers staring at computer screens running the place that had replaced 3,000 before them.
While we are seeing a weak recovery now, entry-level positions are paying a fraction of what they did a decade ago, not far above minimum wage. Those with only a high school education or less have taken the biggest hit, seeing unemployment rates soar to 15%. By contrast, college educated workers have an unemployment rate as low as 5%.
Of course the challenge for me has always been to translate Bob?s lofty, 30,000-foot views, steeped in millennia of history, into Trade Alerts tomorrow morning which make money for you, the reader, by Monday. That?s easier said than done.
Given my 130% net trading profit since the service started 38 months ago, I?d say so far, so good.
https://www.madhedgefundtrader.com/wp-content/uploads/2013/04/Robert-Reich.jpg300231Mad Hedge Fund Traderhttps://madhedgefundtrader.com/wp-content/uploads/2019/05/cropped-mad-hedge-logo-transparent-192x192_f9578834168ba24df3eb53916a12c882.pngMad Hedge Fund Trader2014-01-24 01:03:582014-01-24 01:03:58Another Dinner With Robert Reich
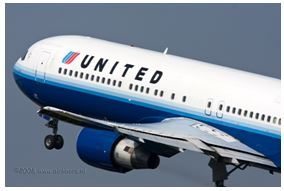
Featured Trade: (THURSDAY FEBRUARY 20 MELBOURNE, AUSTRALIA STRATEGY LUNCH), (AIRLINE STOCKS ARE CLEARED FOR TAKEOFF), (AAL) (UAL), (DAL), (LUV), (TESTIMONIAL)
American Airlines Group Inc. (AAL)
United Continental Holdings, Inc. (UAL)
Delta Air Lines Inc. (DAL)
Southwest Airlines Co. (LUV)
https://madhedgefundtrader.com/wp-content/uploads/2019/05/cropped-mad-hedge-logo-transparent-192x192_f9578834168ba24df3eb53916a12c882.png00Mad Hedge Fund Traderhttps://madhedgefundtrader.com/wp-content/uploads/2019/05/cropped-mad-hedge-logo-transparent-192x192_f9578834168ba24df3eb53916a12c882.pngMad Hedge Fund Trader2014-01-23 01:06:012014-01-23 01:06:01January 23, 2014
When I was a young, clueless investment banker at Morgan Stanley 30 years ago, the head of equity sales took me aside to give me some fatherly advice. Never touch the airlines.
The profitability of this industry was totally dependent on fuel costs, interest rates and the state of the economy and management hadn't the slightest idea of what any of these were going to do. If I were ever tempted to buy an airline stock, I should lie down and take a long nap first.
At the time, the industry had just been deregulated and was still dominated by giants like Pan Am, TWA, Eastern Air, Western, Laker, Braniff, and a new low cost upstart called People Express. None of these companies exist today. It was the best investment advice that I ever got.
If you total up the P&L's of all of the US airlines that ever existed since Orville and Wilber Wright first flew in 1903 (their pictures are on my new anti-terrorism edition commercial pilots license), it is a giant negative number, well in excess of $100 billion. This is despite the massive government subsidies that have prevailed for much of the industry's existence.
The sector today is hugely leveraged, capital intensive, heavily regulated, highly unionized, offers customers terrible service, and is constantly flirting with or is in bankruptcy. Its track record is horrendous. It is a prime terrorist target. A worse nightmare of an industry never existed.
I became all too aware of the travails of this business while operating my own charter airline in Europe as a sideline to my investment business. The amount of paperwork involved in a single international flight was excruciating. Every country piled on fees and taxes wherever possible. The French air traffic controllers were always on strike, the Swiss were arrogant, and the Italians unintelligible and out of fuel.
The Greek military controllers once lost me over the Aegean Sea for two hours, while the Yugoslavs sent out two MIG fighter jets to intercept me. As for the US? Did you know that every rivet going into an American built aircraft must first be inspected by the government and painted yellow before it can be used in manufacture?
While flying a Red Cross mission into Croatia, I got shot down by the Serbians, crash landed at a small Austrian Alpine river, and lost a disc in my back. I had to make a $300 donation to the Zell Am Zee fire department Christmas fund to get their crane to lift my damaged aircraft out of the river (see picture below). Talk about killing the competition!
So you may be shocked to hear that I think there is a great opportunity here in airline stocks. A Darwinian weeding out has taken place over the last 30 year that has concentrated the industry so much that it would attract the interest of antitrust lawyers, if consumers weren?t such huge beneficiaries.
With the American-US Air (AAL) deal done, the top four carriers (along with United-Continental (UAL), Delta (DAL), and Southwest (LUV) will control 90% of the market. That is up from 60% only five years ago. The industry has fewer seats than in 1982; while inflation adjusted fares are down 40%. Analysts are referring to this as the industry?s new ?oligopoly advantage.?
Any surprise bump up in oil prices is met with a blizzard of higher fares, baggage fees, and fuel surcharges. I can't remember the last time I saw an empty seat on a plane, and I travel a lot. Lost luggage rates are near all time lows because so few now check in bags. Interest rates staying at zero don?t hurt either.
The real kicker here is that stock in an airline is, in effect, a free undated short volatility play on oil. If oil doesn?t move, airline stocks go up. You may have noticed that I have written at length on the rough balance that has emerged in the global oil markets, where rising Chinese demand is offset by increasing US production from fracking. The end result has been the lowest volatility in the oil market in years.
This is not a bad position to have when peace talks in Geneva with Iran threaten to collapse the price of oil. On top of that, you can add the huge economies offered by the new Boeing 787, known in the industry as the ?plastic fantastic, which uses 40% less fuel than existing models.
I picked United Continental Group (UAL) because it suffered from some integration problems from their recent merger, like a reservations system that wouldn?t work. That gives them the greatest snap back potential.
And even if the fuel savings turn out to be modest, a recovering US economy should boost profitability, given its recent maniacal pursuit of controlling costs. Some airlines have become so cost conscious that they are no longer painting their planes to gain fuel savings from carrying 100 pounds less weight! Just the missing pretzels alone should be worth a few cents a share in earnings.
This is not just a US development, but an international one. The International Air Transport Association (IATA) has just raised its forecast of member earnings from $7.6 billion in 2012 to $10.6 billion in 2013, a gain of 40%. The biggest earnings are based in Asia (China Southern Airlines, China Eastern Airlines, Air China), followed by those in the US, with $3.6 billion in profits.
Add all this together, and the conclusion is clear. The checklist is complete, the IFR clearance is in hand, and it is now time to push the throttles to the firewall for the airline stocks and get this bird off the ground.
And no, I didn't get free frequent flier points for writing this piece.
Meet the New Big Four
Time to Consider Another Career
Fly the Friendly Skies with a Long Position
https://www.madhedgefundtrader.com/wp-content/uploads/2013/04/United-Airplain.jpg191284Mad Hedge Fund Traderhttps://madhedgefundtrader.com/wp-content/uploads/2019/05/cropped-mad-hedge-logo-transparent-192x192_f9578834168ba24df3eb53916a12c882.pngMad Hedge Fund Trader2014-01-23 01:04:362014-01-23 01:04:36Airline Stocks are Cleared for Take Off
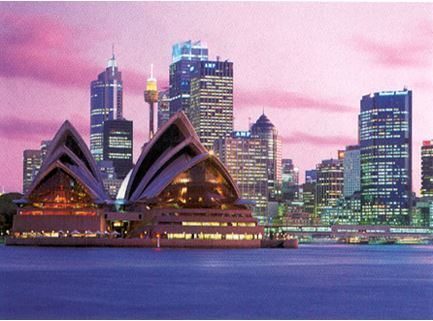
Featured Trade: (FRIDAY FEBRUARY 14 SYDNEY, AUSTRALIA STRATEGY LUNCH), (WHY THE WORLD HATES THE AUSSIE), (FXA), (EWA), (EWZ), (FXI), (REVISITING CHENIERE ENERGY), (LNG), (USO), (UNG)
CurrencyShares Australian Dollar Trust (FXA)
iShares MSCI Australia (EWA)
iShares MSCI Brazil Capped (EWZ)
iShares China Large-Cap (FXI)
Cheniere Energy, Inc. (LNG)
United States Oil (USO)
United States Natural Gas (UNG)
https://madhedgefundtrader.com/wp-content/uploads/2019/05/cropped-mad-hedge-logo-transparent-192x192_f9578834168ba24df3eb53916a12c882.png00Mad Hedge Fund Traderhttps://madhedgefundtrader.com/wp-content/uploads/2019/05/cropped-mad-hedge-logo-transparent-192x192_f9578834168ba24df3eb53916a12c882.pngMad Hedge Fund Trader2014-01-22 01:06:282014-01-22 01:06:28January 22, 2014
Come join me for lunch at the Mad Hedge Fund Trader?s Global Strategy Update, which I will be conducting in Sydney, Australia at 12:00 noon on Friday, February 14, 2014. An excellent meal will be followed by a wide ranging discussion and a minute question and answer period.
I?ll be giving you my up to date view on stocks, bonds, currencies commodities, precious metals, and real estate. I also hope to provide some insight into America?s opaque and confusing political system. And to keep you in suspense, I?ll be throwing a few surprises out there too. Tickets are available for $199.
I?ll send you a PowerPoint presentation in advance to cover the broad range of subjects we may discuss.
The lunch will be held at an exclusive downtown waterfront restaurant the details of which will be emailed with your purchase confirmation.
I look forward to meeting you, and thank you for supporting my research. To purchase tickets for the luncheons, please go to my online store.
https://www.madhedgefundtrader.com/wp-content/uploads/2014/01/Sydney-AU.jpg321433Mad Hedge Fund Traderhttps://madhedgefundtrader.com/wp-content/uploads/2019/05/cropped-mad-hedge-logo-transparent-192x192_f9578834168ba24df3eb53916a12c882.pngMad Hedge Fund Trader2014-01-22 01:05:472014-01-22 01:05:47Friday February 14 Sydney Australia Strategy Lunch
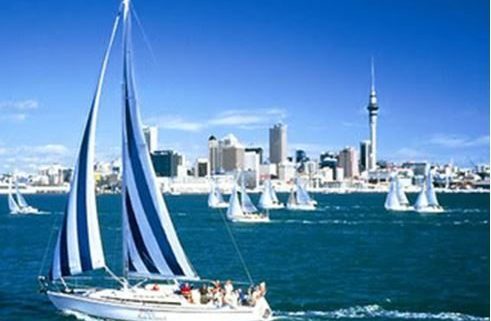
Featured Trade: (FEBRUARY 12 AUCKLAND NEW ZEALND STRATEGY LUNCH), (HOW OBAMACARE WILL BOOST YOUR PORTFOLIO), (XLV), (GILD), (XLS), (XPH), (XBI), (GOOG)
Health Care Select Sector SPDR (XLV)
Gilead Sciences Inc. (GILD)
Exelis Inc. (XLS)
SPDR S&P Pharmaceuticals ETF (XPH)
SPDR S&P Biotech ETF (XBI)
Google Inc. (GOOG)
https://madhedgefundtrader.com/wp-content/uploads/2019/05/cropped-mad-hedge-logo-transparent-192x192_f9578834168ba24df3eb53916a12c882.png00Mad Hedge Fund Traderhttps://madhedgefundtrader.com/wp-content/uploads/2019/05/cropped-mad-hedge-logo-transparent-192x192_f9578834168ba24df3eb53916a12c882.pngMad Hedge Fund Trader2014-01-21 09:21:142014-01-21 09:21:14January 21, 2014
Come join me for lunch at the Mad Hedge Fund Trader?s Global Strategy Update, which I will be conducting in Auckland, New Zealand on Wednesday, February 12, 2014. An excellent meal will be followed by a wide-ranging discussion and question-and-answer period.
I?ll be giving you my up-to-date view on stocks, bonds, currencies, commodities, precious metals, and real estate. I also hope to provide some insight into America?s opaque and confusing political system. And to keep you in suspense, I?ll be throwing a few surprises out there too. Tickets are available for $189.
I?ll be arriving at 11:00 and leaving late in case anyone wants to have a one-on-one discussion, or just sit around and chew the fat about the financial markets. The lunch will be held at a downtown boutique hotel the location of which that will be emailed with your purchase confirmation.
I look forward to meeting you, and thank you for supporting my research. To purchase tickets for the luncheon, please go to my online store.
https://www.madhedgefundtrader.com/wp-content/uploads/2014/01/Auckland.jpg350491Mad Hedge Fund Traderhttps://madhedgefundtrader.com/wp-content/uploads/2019/05/cropped-mad-hedge-logo-transparent-192x192_f9578834168ba24df3eb53916a12c882.pngMad Hedge Fund Trader2014-01-21 09:20:292014-01-21 09:20:29Wednesday, February 12 Auckland, New Zealand Strategy Lunch
Featured Trade: (MAD HEDGE FUND TRADER SURGES AHEAD WITH A 5.78% 2014 PROFIT), (SPY), (TLT), (XLK), (XLF), (XLE), (AAPL), (SFTBY), (FXY), (AT&T IS DILAING A WRONG NUMBER), (T), (VZ), (NFLX), (AMZN)
SPDR S&P 500 (SPY)
iShares 20+ Year Treasury Bond (TLT)
Technology Select Sector SPDR (XLK)
Financial Select Sector SPDR (XLF)
Energy Select Sector SPDR (XLE)
Apple Inc. (AAPL)
SoftBank Corp. (SFTBY)
CurrencyShares Japanese Yen Trust (FXY)
AT&T, Inc. (T)
Verizon Communications Inc. (VZ)
Netflix, Inc. (NFLX)
Amazon.com Inc. (AMZN)
https://madhedgefundtrader.com/wp-content/uploads/2019/05/cropped-mad-hedge-logo-transparent-192x192_f9578834168ba24df3eb53916a12c882.png00Mad Hedge Fund Traderhttps://madhedgefundtrader.com/wp-content/uploads/2019/05/cropped-mad-hedge-logo-transparent-192x192_f9578834168ba24df3eb53916a12c882.pngMad Hedge Fund Trader2014-01-17 01:05:582014-01-17 01:05:58January 17, 2014
Legal Disclaimer
There is a very high degree of risk involved in trading. Past results are not indicative of future returns. MadHedgeFundTrader.com and all individuals affiliated with this site assume no responsibilities for your trading and investment results. The indicators, strategies, columns, articles and all other features are for educational purposes only and should not be construed as investment advice. Information for futures trading observations are obtained from sources believed to be reliable, but we do not warrant its completeness or accuracy, or warrant any results from the use of the information. Your use of the trading observations is entirely at your own risk and it is your sole responsibility to evaluate the accuracy, completeness and usefulness of the information. You must assess the risk of any trade with your broker and make your own independent decisions regarding any securities mentioned herein. Affiliates of MadHedgeFundTrader.com may have a position or effect transactions in the securities described herein (or options thereon) and/or otherwise employ trading strategies that may be consistent or inconsistent with the provided strategies.