Follow Up to Trade Alert - (IWM) March 8, 2016
As a potentially profitable opportunity presents itself, John will send you an alert with specific trade information as to what should be bought, when to buy it, and at what price.
?
Trade Alert - (IWM)- BUY-UPDATE
Buy the Russell 2000 iShares ETF (IWM) April, 2016 $112-$117 in-the-money vertical bear put spread at $4.44 or best
Opening Trade
3-8-2016
expiration date: April 15, 2016 (tax day)
Portfolio weighting: 10%
Number of Contracts = 22 contracts
You can pay all the way up to $4.60 for this spread and it still makes sense.
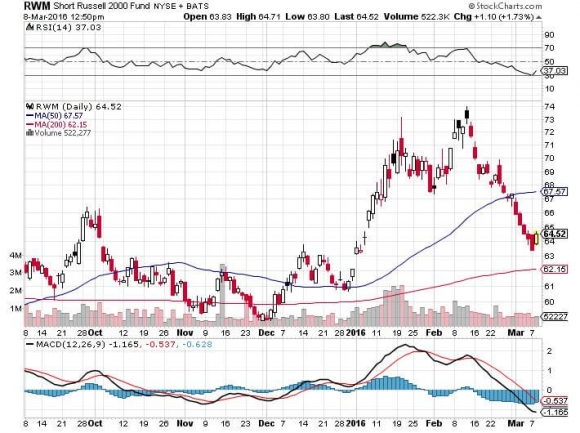
If you can?t trade options buy the -1X ProShares Short Russell 2000 ETF (RWM) (click here for the link to the prospectus at http://www.proshares.com/funds/rwm.html).
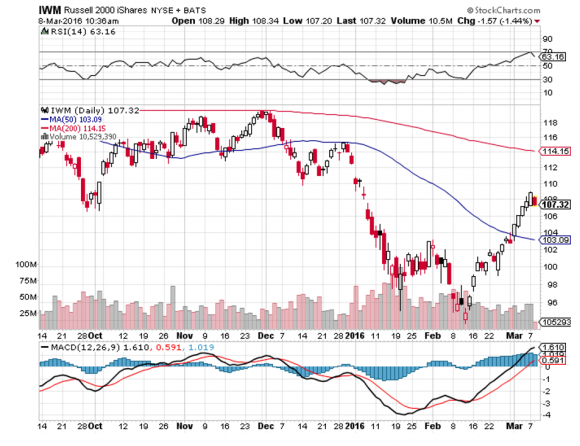
This is a bet that the Russell 2000 iShares ETF (IWM) trades at or below $112 at the April 15 options expiration. It last traded at $107.32.
I always encourage readers to send in questions.
My late mentor, CIA chief William Colby, taught me that questions are always more valuable than answers. Knowing what the enemy doesn?t know is more useful that knowing what they do know.
And this is from a guy who organized the French resistance during WWII, so he should know.
So when a follower asked yesterday what to do with our remaining position in the S&P 500 (SPY) April $182 puts, I leapt on him like a mountain lion.
The short answer is that you keep them, and I?ll tell you why.
The answer is to be found in two words:
IRON ORE
Let me tell you about iron ore. It rusts, and once you get it under your fingernails, you never get it out.
Yesterday, iron ore rocketed by 20%. Iron ore never rockets by 20%. A big daily move for the rusty metal is usually 1%. To see a 20% move means that something weird is going on.
It wasn?t just iron ore.
Look at the recent charts for oil (USO), copper (CU), gold (GLD), gold miners (GDX), silver (SLV), silver miners (SIL), the commodity currencies of the Aussie and the Loonie (FXA), (FXC), and they are all virtually identical.
They show a classic inverse head and shoulders bottom followed by a parabolic move to the upside.
You may recall that in my 2016 Annual Asset Class Review I predicted that energy would be the top performing sector of 2016 (click here).
Gosh! I hate being so right.
However, there is a problem with this picture. Some 100% of this frenetic buying has been short covering.
And therein lies the problem.
Short coverers can?t create new bull markets. Once they buy back the securities they bet were going down, they tend to sit on their hands.
That is only enough buying to move the indexes back up to the top of the recent ranges AND NO MORE. There is not enough money to blast prices to new all time highs.
For that you need substantially improving corporate earnings. What we HAVE are flat to modestly growing earnings instead. This is NOT what bull markets are made of.
Let me give you another reason why this is a rally you do NOT want to take home and introduce to your mother.
Take a look at the chart below for the Dow Average, which I borrowed from my friend, Dennis Gartman?s newsletter, and you will see that every rally for the past six months has taken place in the face of falling volume.
Now, back to Trading 101.
Rallies that succeed and breakout to the upside do so on rising volume. Rallies that fail and breakdown to new lows do so on falling volume. That?s the kind of rally we have just seen: the bad kind.
Bad rally! Bad rally!
Not only that, every rally we have seen across all asset classes has been the bad kind, except for gold.
That means this rally will fail as well. It?s just a matter of time. I expect we will churn around here for a bit, sucking in the last few remaining short positions.
Then, when there are no more shorts left, it?s time to take the downtown express one more time.
There is a happy ending to this story. I don?t think we are going to new lows this time around. At the very least we will give up one third to one half of the recent move up, or $7 to $20 S&P 500 (SPY) points.
That will set up a tortuous, mind numbing, hair tearing six-month sideways wedge of higher lows and lower highs in the major stock indexes. Like the victim of a Mike Tyson punch, volatility (VIX) will fall and stay down.
Then in August, investors will start to figure out the Hillary Clinton is going the win the presidential election.
What happened the last time that a Clinton took over the White House? The Dow Average rose 400% in the following eight years. Remember Dow 10,000 by 2,000? That was them.
And you know what? We will get the same kind of stock performance in the next eight years. At least this is how investors will perceive the opportunity.
All of this is a very long-winded way of explaining why I sold short the Russell 2000 today, at least through April.
In falling markets you want to be short small caps. They get much more beaten up during economic slowdowns, don?t have access to new equity or banks loans, and suffer from poor liquidity.
Just thought you?d like to know.
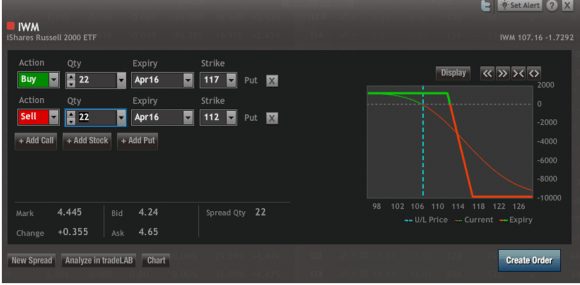
To see how to enter this trade in your online platform, please look at the order ticket below, which I pulled off of optionshouse.
If you are uncertain on how to execute an options spread, please watch my training video on ?How to Execute a Bear Put Debit Spread? by clicking here at http://www.madhedgefundtrader.com/ltt-executetradealerts/.
You must be logged into your account to view the video.
The best execution can be had by placing your bid for the entire spread in the middle market and waiting for the market to come to you. The difference between the bid and the offer on these deep in-the-money spread trades can be enormous.
Don?t execute the legs individually or you will end up losing much of your profit. Spread pricing can be very volatile on expiration months farther out.
Here are the specific trades you need to execute this position:
Buy 22 April, 2016 (IWM) $117 puts at????.?.??$10.20
Sell short 22 April, 2016 (IWM) $112 puts at.????..$5.76
Net Cost:???????????????????......$4.44
Potential Profit: $5.00 - $4.44 = $0.56
(22 X 100 X $0.56) = $1,232 or 12.3% profit in 28 trading days

