From my mountain top aerie in the Oakland Hills I had a front row seat to the spectacular lightning storm that hit San Francisco last week. I saw both towers of the Golden Gate Bridge get hit simultaneously. I just thought I would pass on some of the more amazing pictures. It is all part of life?s rich tapestry. Enjoy.


I'm at the second strike from the left!

In case you missed it, the second hand animal market has crashed. Forced to slash budgets by cash starved municipalities, the nation?s public zoos have been paring back their collections of living exhibits.
The Washington Zoo is trying to offload a 7,000 pound hippopotamus; while the San Francisco Zoo is short some tigers after one ate a visitor and had to be shot. The Portland Zoo was able to liquidate a portfolio of lemurs only because of the popularity of the recent DreamWorks? ?Madagascar 2? animated film.
When zoos are forced to economize, they downsize the big eaters first to save on feed costs; hence, the absence of elephants in San Francisco (Could this be a political gesture?). In fact, zoo staff were recently busted for illegally harvesting acacia on private property, a favorite food of giraffes, which grows wild here after its introduction a century ago. The hardest to move? Baltimore has been trying to sell its snake collection for two years now. Talk about an illiquid market. Maybe they should try AIG. Snake derivatives anyone?

Pink Slips for Tony?

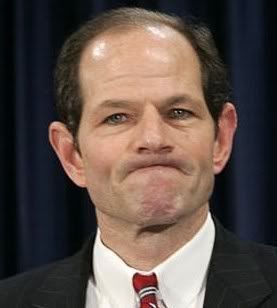
I couldn?t for the life of me figure out why New York?s former governor and federal prosecutor, Elliot Spitzer, wanted to invite me to dinner. He wasn?t flogging a book or promoting a movie, and he certainly wasn?t running for office again. But I went anyway, thinking perhaps the notorious ?Client No.9? might let me peek at his famous black book.
Elliot, who showed up wearing a classic New York blue pin stripped suit that seems oddly out of place in San Francisco, is currently running his family?s commercial real estate business. He told me that the advantages that the US enjoyed over the rest of the world in 1945, such as a monopoly in skilled labor, are now long gone. The driver of the world economy has switched from America to Asia in the nineties.
As a result, income distribution here has morphed from a bell shaped curve to a barbell, with both the wealthy and the poor increasing in numbers, squeezing the middle class. The financial crisis compressed 30 years of change into two, taking us from libertarian Ayn Rand to pay czar Ken Feinberg in one giant leap.
Having cut his teeth prosecuting the Gambino crime family in the eighties, Elliot had some views on the need for more regulation. We only need to enforce the laws on the books, not pass new ones. The ?white collarization? of organized crime has been a secular trend since the sixties. He said the ethical lapses in the run up to the crash were best characterized by a quote from Merrill Lynch?s Jack Robins; ?What used to be a conflict of interest is now a synergy.?
AIG getting 100 cents on the dollar was the greatest scam in history. The US did not extract a high enough price from highly paid executives and shareholders of financial institutions for failure, and should have let more firms go under. As for his own scandal last year, Elliot admitted that he failed, that his flaws were made publicly apparent, and that other politicians should be smarter than he was.
Although Elliot had some good ideas, I was still puzzled over what this was all about as I ploughed through my creme brulee. Perhaps the governor has a pathological need to be in front of the spotlight, even at the risk of flaming out. And no luck with the black book.


Note to self. Don't do your midnight pee next to the bear box. They're called that for a reason. And I'm sorry that my shouting at the hungry, six foot tall black bear standing in front of me, no doubt attracted by my Cheetos, hot dogs, and marshmallows, woke up the campers at the 57 surrounding sites.
Of course it was too dark to find my bear spray. My ursine challenger eventually saw the merit of my logic that the neighbor's bacon stuffed ice chest was more appealing than me, and lumbered off into the darkness. Such was the conclusion of my camping trip on the California coast last weekend.
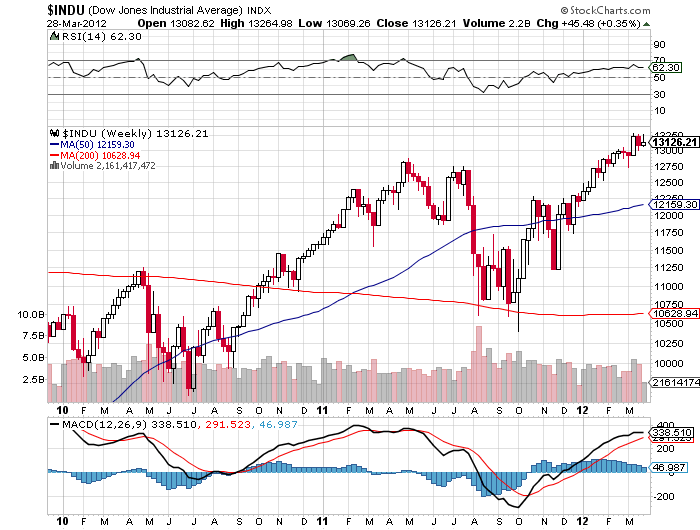
I am now dealing with a bear of a different sort, the financial kind. Never have I seen such a disconnect between the markets and the real economy. We have a 4% GDP stock market and a 2% GDP real economy.
All of a sudden the world has gotten expensive. Stock prices have been levitated by vapor in a faith based rally. Cost cutting, not sales growth, has artificially boosted earnings above subterranean forecasts. Commodity prices are now rolling over because of soured speculation and stockpiling and a dearth of real end consumption. This year?s rise has been entirely driven by multiple expansion, from 11 to 14 times earnings. Will this multiple expand further when earnings disappoint, as Alcoa just did with a 69% YOY drop in profits?
I am using the big up days to buy short dated out-of- the-money puts, which if I get things right should double in value. That's because I keep my favorite quote from John Maynard Keynes pasted to my monitor, ?Markets can remain irrational longer than you can remain liquid.? Sure we're going down more, but zero interest rates won't let us crash. Date your short positions, don?t marry them. This is not the big one. For that, you?ll have to wait until next year.
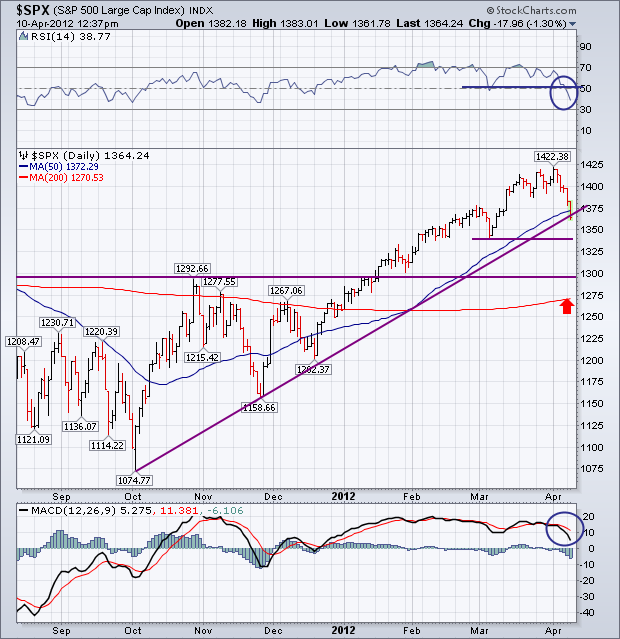

Date, Don?t Marry Those Short Positions
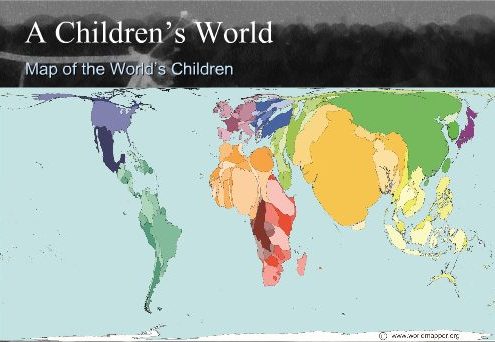
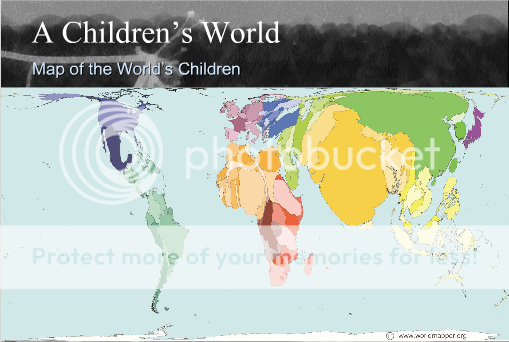
You can never underestimate the importance of demographics in shaping long term investment trends, so I thought I?d pass on these two highly instructive maps.
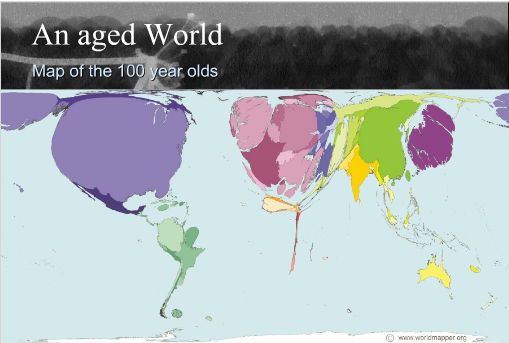
The first shows a map of the world drawn in terms of the population of children, while the second illustrates the globe in terms of its 100 year olds. Notice that China and India dominate the children?s map. Kids turn into consumers in 20 years, stay healthy for a long time, and power economic growth. The US, Japan, and Europe shrink to a fraction of their actual size on the children?s map, so economic growth is in a long term secular downtrend there.
There is more bad news for the developed world on the centenarian?s map, which show these countries ballooning in size to grotesque, unnatural proportions. This means higher social security and medical costs, plunging productivity, and falling GDP growth.
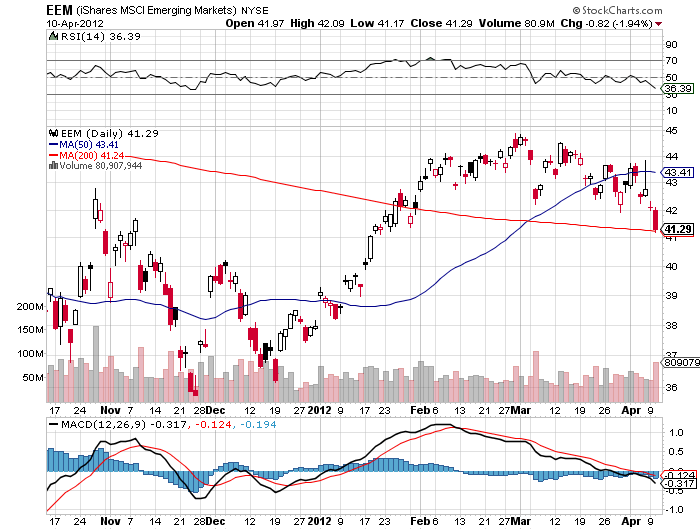
The bottom line is that you want to own equities and local currencies of emerging market countries, and avoid developed countries like the plague. This is why we saw tenfold returns from SOME emerging markets (EEM) over the past ten, and why there is an irresistible force pushing their currencies upward (CYB). Use any major melt downs this year to increase your exposure to emerging markets, as I will.
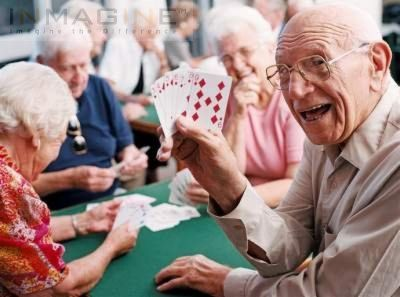
Would You Rather Own Them?

Or Them?
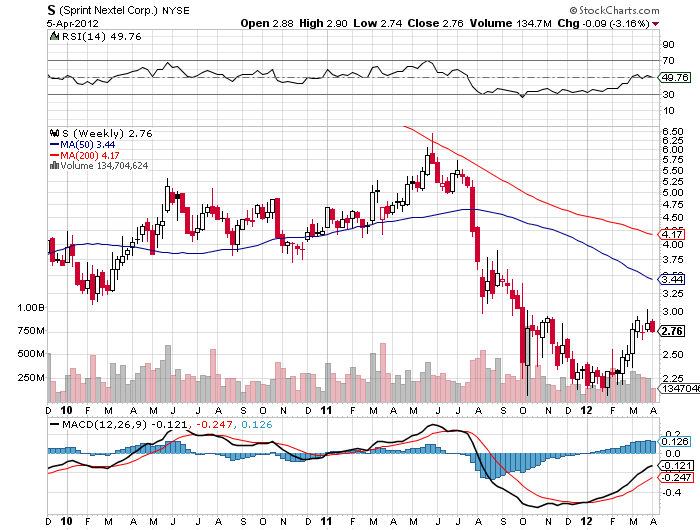
Fear of law suits prevents most analysts from publishing lists of short selling targets. But the GMI Ratings, Inc., a forensic accounting firm, regularly posts lists of public companies they believe may go bankrupt (see http://www.auditintegrity.com ).
Many of their picks reflect the accelerating shift from the old economy to the new economy. With offices in New York and Los Angeles, they look at leverage, market position, debt, and their own proprietary indicators. Another red flag are the legal shenanigans that companies resort to when coming out of a recession, like writing off large amounts of good will.
In the media space, CBS (CBS), Sirius XM Radio (SIRI), and Hertz Global (HTZ) are at risk. In the consumer field, Rite Aid (RAD), Macy?s (M), and Las Vegas Sands (LVS) made the list. Advanced Micro Devices (AMD) is the largest tech company to warrant scrutiny.
Airlines are always a favorite of bankruptcy mavens. The company correctly pegged American Airlines (AMR) as seriously at risk two years ago. Continental (CAL) dodged the executioner by merging with United Airlines. Sprint Nextel (S) tops the list of telecom companies. Better take that portfolio out and give it a good scrubbing.
Looks Like I Hooked a Whopper
Regular readers of this letter know that I rely on long term demographic trends to predict the direction of global financial markets. Let me approach this topic from a different angle, measuring the number of retirees a population must support versus the anticipated burden in 20 years, and its implications.
I start with the basket cases. Japan?s problems on this front are well known, with a retiree population of 30% today growing to 56% by 2030. That means every worker will be saddled with the costs of maintaining a senior citizen. Italy is worse, with the retiree load soaring from 30% to 60%. The rest of developed Europe is posting similar numbers. This is why you rarely hear me issuing ?BUY? recommendations on European companies, especially in the retail sector.
The US is stuck in the middle. Some 21% of our 310 million souls are retired today, and that is growing to 48% in 20 years. If you think our social security funding problems are bad now, just wait. On our current trajectory, bankruptcy is assured. Our saving grace is the large number of young immigrants who are continuously entering the country, legal and otherwise.
China is in a unique situation because of its ?one child? policy, which has reduced population growth by 400 million over the last 30 years. This guarantees that the country will undergoing a slow ?Japanization? that raises its ratio of retirees from 14% today to 42% by 2020. You can count on the Chinese economic miracle to hit a wall in about five years as a vast share of resources have to be redirected to supporting long lived senior citizens, who live on a healthier diet than your or I.
Other emerging markets are in a far healthier position. Only 8% of India?s 1.2 billion are retirees today, and that will only reach 20% in 20 years. Vietnam, Brazil, Mexico, Indonesia, and Malaysia are looking at the same numbers. One of the reasons that these countries don?t have to suffer the crushing expense of western style social safety nets is that they don?t need them. This is the basis for my constant table pounding that this is where you need to be overweighting your equity exposure.
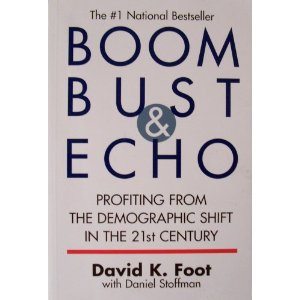
I?ll be going into this subject in more depth next week, when I explain why demographics is so important. Until then your homework assignment is to read the excellent book, Boom, Bust, and Echo by David K. Foot, which you can buy by click here.
The bottom line message here is to be nice to your cleaning lady. She may be supporting you someday.

The ?Japanization? of China
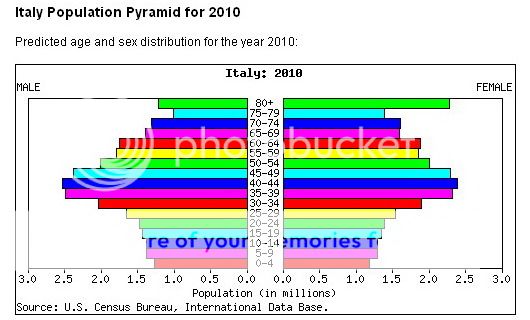
They?re Not Making Italians Anymore

This is Where You Want to Put Your Money
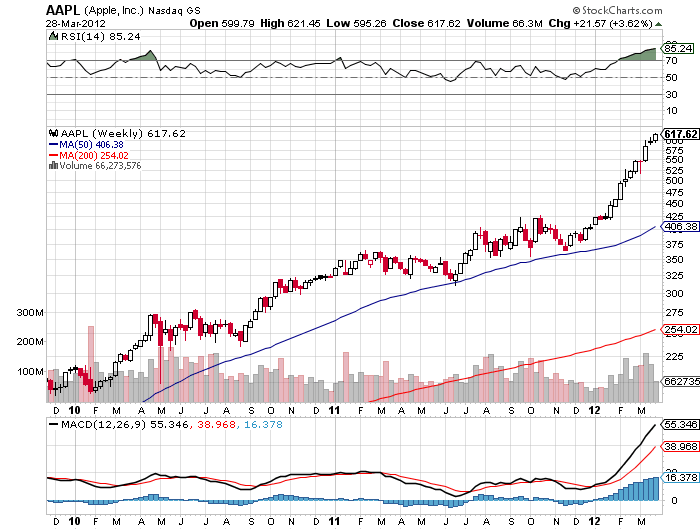
I was more than amused when technology analyst superstar, Piper Jaffray?s Gene Munster, put out his own forecast that Apple (AAPL) would reach $1,001. Munster made the call after conducting a survey that showed that 40% of students plan on buying an iPhone in the next 6 months, while 19% of non-tablet owners plan on purchasing a tablet in the next 6 months.The shares responded by immediately running up to a new all-time high of $632.
For my own prediction of this target, you have to reach back 18 months, when it first breached $300 (click here for the piece). With the establishment now jumping on the bandwagon, is this an indicator of a short term trading top in the sought after stock? Those deep out of the money short dated Apple puts are starting to look more interesting by the day.
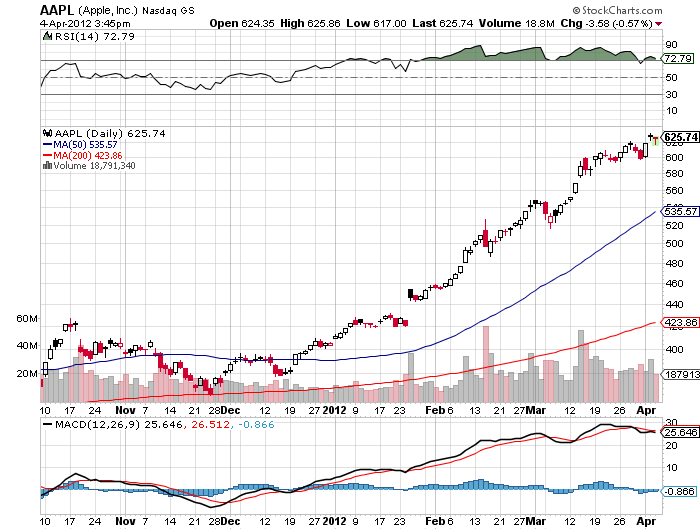

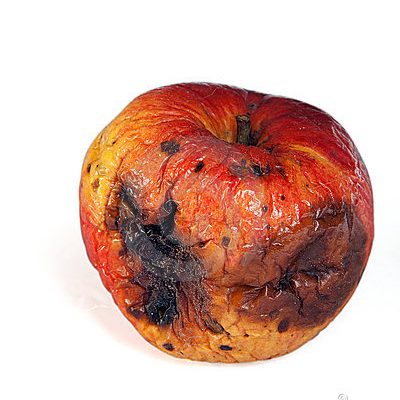
Is Apple Losing Its Flavor?
The handful of Chinese army officers I huddled with in the underground bunker all stared intently at their watches. Three, two, one, and then KABOOM! At exactly 12:00 noon, the blast of distant artillery sent a five inch shell screaming over our heads and exploded into the hill above us. The ground shook under our feet, causing dust to drift down from the concrete ceiling above us. It was 1976, and The People's Republic of China just let lose its daily symbolic protest against its errant rebellious province, known locally as the Republic of China, and to you and me, as Taiwan.
Fast forward 36 years later and the Middle Kingdom is sending salvos of money raining down on that prosperous island. Two years ago, China Mobile (CHL), the world's largest cell phone company, bought 12% of Far Eastone Telecommunications (4904.Taiwan). Although a small deal, it represented the first ever direct investment from China into Taiwan. The move triggered a takeover binge by big Chinese companies of their offshore cousins.
It was only a few years ago Taiwanese businessmen suffered long prison terms for just visiting, let alone investing in China, which they have done in a major, but surreptitious way, for 30 years. Readers of this letter are well aware of the long term attraction of both of these countries, which see GDP growth rates at a multiple of our own.
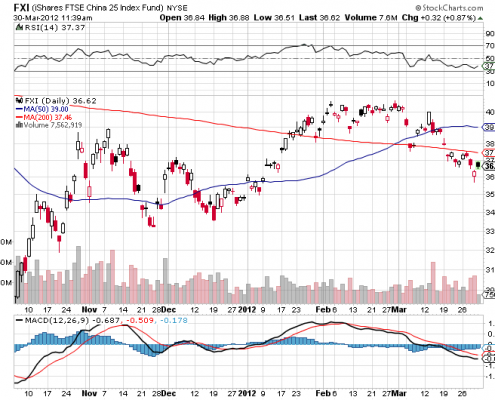
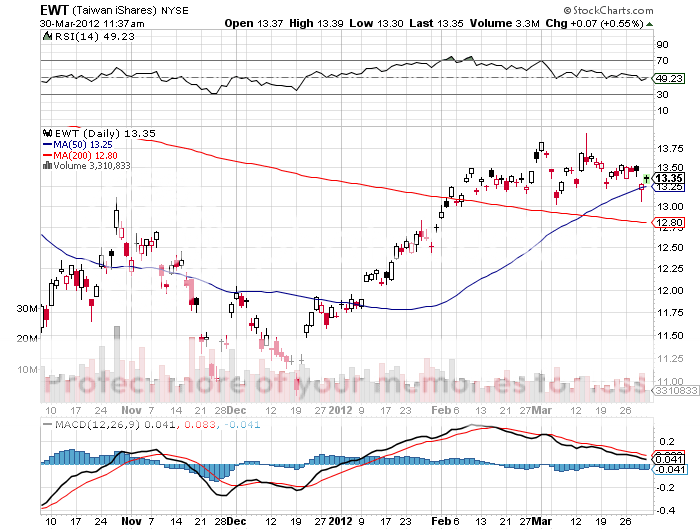
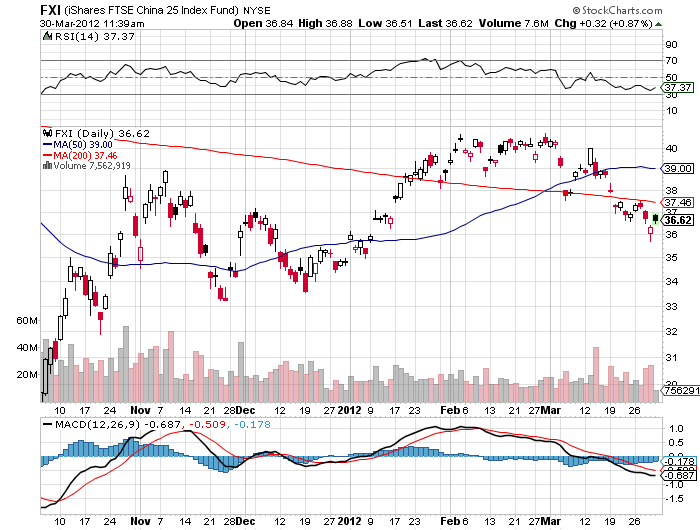
Closer ties between China and Taiwan auger well for the stock markets of the two high growth countries. The iShares MSCI Taiwan fund ETF (EWT) jumped by 17% in Q1, 2012. The iShares FTSE China 25 Index (FXI) has done less well, up 5%, as the country grapples with a temporarily slowing economy. At some stage, a country that is growing at four times our own rate, but at the same earnings multiple, will be a buy. But it appears not yet.
In the meantime, I guess that Beijing figured out that if you can't beat them, buy them. The proxy takeover bid is mightier than the sword.
A few years ago, I went to a charity fund raiser at San Francisco's priciest jewelry store, Shreve & Co., where the well-heeled men bid for dates with the local high society beauties, dripping in diamonds and Channel No. 5. Well fueled with champagne, I jumped into a spirited bidding war for one of the Bay Area's premier hotties, who shall remain nameless. She?s happily married to a tech titan now, and gentlemen don?t tell. Suffice it to say, she has a sports stadium named after her.
The bids soared to $10,000, $11,000, $12,000. After all, it was for a good cause. But when it hit $12,400, I suddenly developed lockjaw. Later, the sheepish winner with a severe case of buyer's remorse came to me and offered his date back to me for $12,000.? I said ?no thanks.? $11,000, $10,000, $9,000?? I passed.
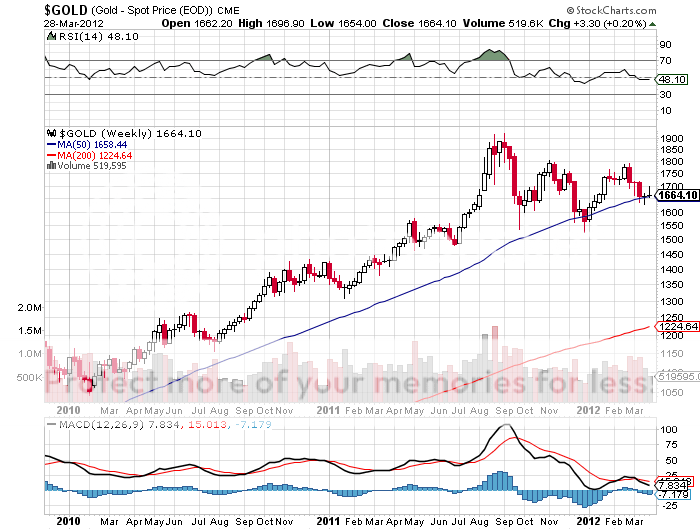
The current altitude of the stock market reminds me of that evening. If you rode gold (GLD) from $800 to $1,900, oil, from $35 to $110, and Apple (AAPL) from $200 to $610, why sweat trying to eke out a few more basis points, especially when the risk/reward ratio sucks so badly, as it does now? I have a feeling that those who loaded up on stocks in March may develop the same sort of buyer?s remorse that I witnessed at Shreve?s.
I realize that many of you are not hedge fund managers, and that running a prop desk, mutual fund, 401k, pension fund, or day trading account has its own demands. But let me quote what my favorite Chinese general, Deng Xiaoping, once told me, ?There is a time to fish, and a time to hang your nets out to dry.?
At least then I'll have plenty of dry powder for when the window of opportunity reopens for business. So while I'm mending my nets, I'll be building new lists of trades for you to strap on when the sun, moon, and stars align once again.
See Any Similarity?

Time to Mend the Nets