Has the Value of Your Home Just Peaked?
Lately, my inbox has been flooded with emails from subscribers asking how to hedge the value of their homes. This can only mean one thing: the residential real estate market has peaked.
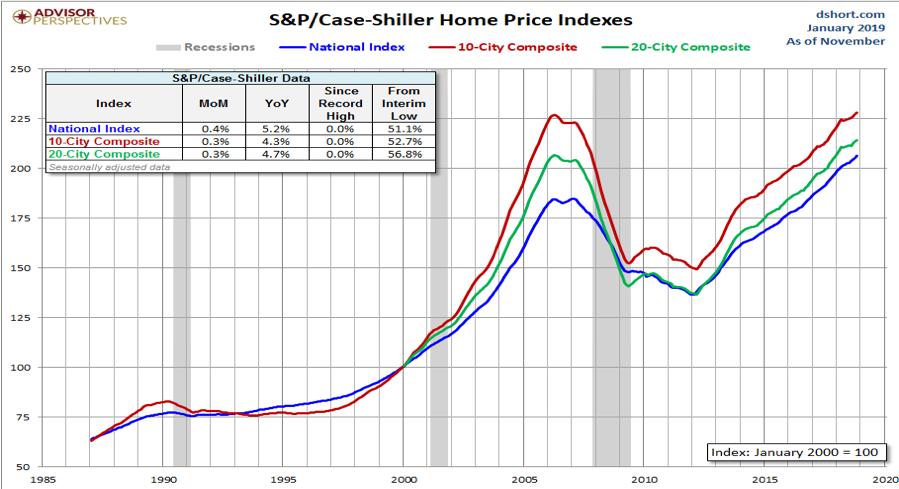
They have a lot to protect. Since prices hit rock bottom in 2011 and foreclosures crested, the national real estate market has risen by 50%.
I could almost tell you the day the market bounced. That’s when a couple of homes in my neighborhood that had been for sale for years suddenly went into escrow.
The hottest markets, like those in Seattle, San Francisco, and Reno, are up by more than 125%, and certain neighborhoods of Oakland, CA have shot up by 400%.
The concerns are confirmed by data that started to roll over in the spring and have been dismal ever since. It is not just one data series that has rolled over, they have all gone bad. One bad data point can be a blip. An onslaught is a new trend. Let me give you a dismal sampling.
*Home Affordability hit a decade low, thanks to rising prices and interest rates and trade war-induced soaring construction costs
*July Housing Starts have been in a tailspin as tariff-induced rocketing costs wipe out the profitability of new homes
*New Home Sales collapsed YOY.
*14% of all June Real Estate Listings saw price cuts, a two-year high
*Chinese Buying of West Coast homes has vaporized over trade war fears
Fortunately, investors have a lot of options for either hedging the value of their own homes or making a bet that the market will fall.
In 2006, the Chicago Mercantile Exchange (CME) started trading futures contracts for the Corelogic S&P/Case-Schiller Home Price Index, which covered both U.S. residential and commercial properties.
The Case-Shiller index, originated in the 1980s by Karl Case and Robert Shiller, is widely considered to be the most reliable gauge to measure housing price movements. The data comes out monthly with a three-month lag.
This index is a widely-used and respected barometer of the U.S. housing market and the broader economy and is regularly covered in the Mad Hedge Fund Trader biweekly global strategy webinars.
The composite weight of the CSI index is as follows:
- Boston 7.4%
- Chicago 8.9%
- Denver 3.6%
- Las Vegas 1.5%
- Los Angeles 21.2%
- Miami 5%
- New York 27.2%
- San Diego 5.5%
- San Francisco 11.8%
- Washington DC 7.9%
However, these contracts suffer from the limitations suffered by all futures contracts. They can be illiquid, expensive to deal in, and you probably couldn’t get permission from your brokers to trade them anyway.
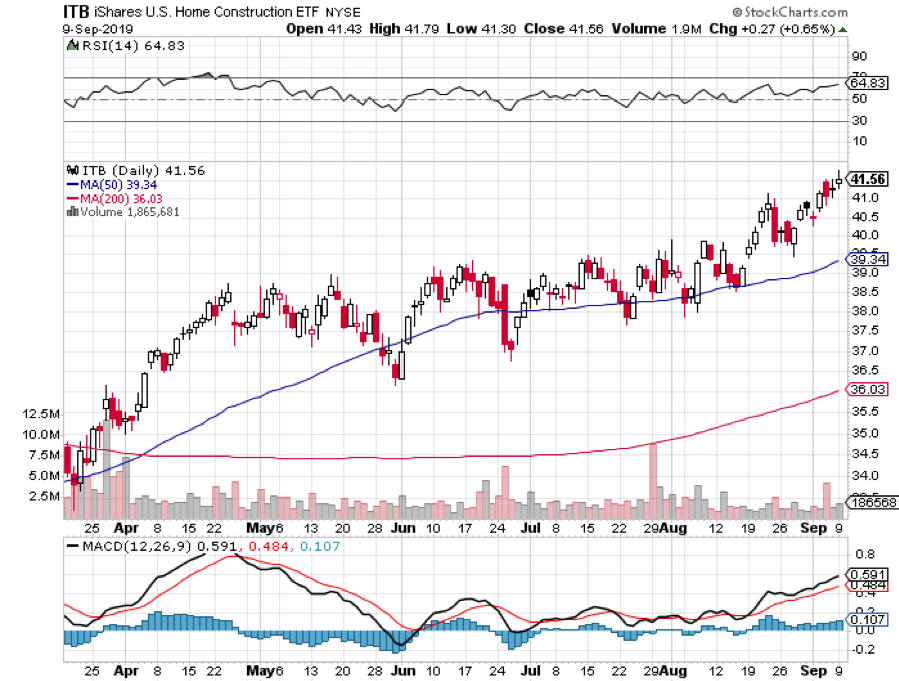
If you want to be more conservative, you could take out bearish positions on the iShares US Home Construction Index (ITB), a basket of the largest homebuilders (click here for their prospectus). Baskets usually present half the volatility and therefore half the risk of any individual stock.
If real estate is headed for the ashcan of history, there are far bigger problems for your investment portfolio than the value of your home. Real estate represents a major part of the US economy and if it is going into the toilet, you could too.
It is joined by the sickly auto industry. Thanks to the trade wars, farm incomes are now at a decade low. As we lose each major segment of the economy, the risk is looming that the whole thing could go kaput. That, ladies and gentlemen, is called a recession and a bear market.
On the other hand, you could take no action at all in protecting the value of your home.
Those who bought homes a decade ago, took a ten-year cruise and looked at the value of their residence today will wonder what all the fuss is about. By the way, I met just such a person on the Queen Mary 2 last summer. Yes, ten years at sea!
And the next recession is likely to be nowhere near as bad as the last one, which was a twice-a-century event. So it’s probably not worth selling your home and buying it back later, as I did during the Great Recession.
See you onboard!
In Your Future?


