January 21, 2014 - MDT Pro Tips A.M.
While the Diary of a Mad Hedge Fund Trader focuses on investment over a one week to six-month time frame, Mad Day Trader, provided by Jim Parker, will exploit money-making opportunities over a brief ten minute to three day window. It is ideally suited for day traders, but can also be used by long-term investors to improve market timing for entry and exit points.
Current Positions
APPL Long????????????? ? ?? ????? 520.70????????????????????? 520
Orders are "stop on close" unless stated otherwise.
...............................................................................................
Today's Working Orders
No working orders........
........................................................................................................
Stocks...
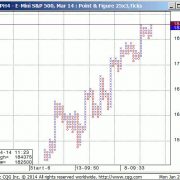
Spu's...the long term point & figure shows we still need to sustain higher on the year for new upside tgt's.
EWP...39.76 is support and the downside pivot.
BRKA...17,100 is the 200 day mvg avg and support.
Nikkei...put in it's low on a Full Moon. This index remains firm until that low is closed below.
?
Bonds...
Bonds...131.24 is weekly resistance.
?
FX...
Yen...went right to the qtrly pivot and sell level last week when the Equities sold off.
I won't recommend trades or get involved when I don't have eyes on the market. Hence, I canceled all my orders before going off grid.
I look for the Yen to remain highly correlated to both the Nikkei and U.S. Equities.
GBP/JPY...is caught in a 2 figure range. Closing below 170 is price negative. Conversely this cross needs two closes over 172 for? a couple days to signal another run up.
An upside breakout would be reflective of a "risk on" board.
?
Commodities...
Oil...94.80-95.00 is short term resistance and the near term upside pivot.
Gold...1265 level is a static resistance area that doesn't go away. Closes over this level are needed for higher.
Gold is caught between 1180 and 1265 on the long term Point& Figure chart.
General Comments orValuable Insight
I'm back in ChiBeria with internet access.
The next two days we'll be paying close attention to our old friend Spu/Bonds to verify the next move in the Indices.
On Monday's market rout this couldn't print the 50 day mvg avg. which is Bullish Equities.
The picture is simple, we need a couple of closes over the S&P high for more upside. Presently, there is a double top on the Point & Figure chart.
Last weeks lows look good,unfortunately we were stopped out of out of our remaining Long SSO position.
The general game remains the same.
Strong Equities = Weak Yen...?when the equities bottom the Yen has been topping (hitting resistance).
Equity support should continue to align with precious metals resistance.
Short Term View...
Keep trading to make money. The opportunity will be in individual names.
Individual stocks look to be an easier read based off their own technical s.
We have a Long Equity Bias.
For Glossary of terms and abbreviations click here.


