January 28, 2013 - MDT Pro Tips A.M.
While the Diary of a Mad Hedge Fund Trader focuses on investment over a one week to six-month time frame, Mad Day Trader, provided by Jim Parker, will exploit money-making opportunities over a brief ten minute to three day window. It is ideally suited for day traders, but can also be used by long-term investors to improve market timing for entry and exit points.
Current Positions
APPL Long????????????? ? ?? ????? 520.70
We've canceled our sell stop in AAPL.
It seems to have a big sell off every earnings.
511 is weekly mvg avg support.
477-482 is the buy zone.
We'll take a look after the opening
Orders are "stop on close" unless stated otherwise.
...............................................................................................
Today's Working Orders
No working orders
.........................................................................................
Stocks...
Spu's...I'm looking to buy around 1730 with a very tight stop.
Presently, the Spu's are holding point & figure support @ 1770.
Yesterdays low was a normal standard deviation move for the Spu's of 80 points. I'd like to see it over 100 points from the high before I buy.
Nasd 100...3440 +- 5 points is the next tgt area.
GS...needs a Friday close above 164.77 to avoid an ORL month.
This is a price negative pattern.
COF...71.02 ORL monthly #
C...Citigroup needs recovery over 50.27 Friday to hold up technically.
JPM...as stated yesterday has the same potential pattern.
WFC & BAC chart patterns still look viable.
KBE...put in an ORL week. A Friday close below 31.92 puts in an ORL Month.
XLF...21.00 is the monthly ORL #.
XBD...Broker dealer Index has a negative pattern as well. A Friday close below 15050 would lead to a good sell off.
?
Bonds...
30 yr...133.15 is the upper end of our resistance area.
TBT...put in an ORH day yesterday not confirmed by the futures.
A close over 72 is needed for confirmation of upside follow through.
?
FX...
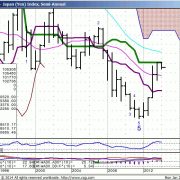
Yen has the same chart pattern as the Spu's. In fact it's been the same trade trade only the inverse.
USD/JPY...needs all new price action over 105.50 for more Yen weakness, just as the Spu's need new closes higher on the year over 1846.
Commodities...
Natgas...maintaining over 4.80 is short term positive. Closing below 4.69 will lead to a further sell-off.
?
General Comments orValuable Insight
I'm not looking for a low in the Indices until at least Wednesday afternoon.
Everybody is still so bulled up on Equities it has me concerned.
The Financials helped propel the rally in Equities, now they are leading the sell off.
The big financial names are all showing similar patterns. As the Bonds have caught a bid from the first of the year the Financials have suffered.
I don't like to fade the yearly closing price action, which started with Bond strength followed weeks later by Equity weakness.
Having said that, this looks to be a pretty good low in the TBT.(high in the 30 Yr.)
Trade your time frames and capital flows. The big game is tomorrow afternoon.
Short Term View...
Keep trading to make money. The opportunity will be in individual names.
Individual stocks look to be an easier read based off their own technical s.
We are neutral Equities. The next several weeks are setting up to be a big trading affair.
For Glossary of terms and abbreviations click here.


