July 11, 2013 - MDT Pro Tips A.M.
While the Diary of a Mad Hedge Fund Trader focuses on investment over a one week to six-month time frame, Mad Day Trader, provided by Jim Parker, will exploit money-making opportunities over a brief ten minute to three day window. It is ideally suited for day traders, but can also be used by long-term investors to improve market timing for entry and exit points.
No Positions..
Stocks..
GOOG...924 was the old pre-market high and tgt. This level will run the next swing in GOOG.
NFLX...248.85 is the old high, 262 is next resistance.
DAX...is over the 8000 pivot.
Bonds...
30 yr....The long term point & figure chart has not put in an upside reversal since 142.00.?This would take a print of 135.05-11 to show downside exhaustion. 135 is also the qtrly level?with all the long term Fib matches it recently failed from. 134.00-133.27 needs to keep holding on breaks for higher.
Old support now becomes new resistance.
Bunds...are coming into weekly resistance. They could rally as high as 143.40 today and reject. Only a close over 143.75 would have me looking for another swing up.
FX...
Euro...132.28 is weekly resistance. 130.00 is support.
EUR/AUD.. 141.47? will act as the near term pivot. This level was mid point last night for 80 pip?moves in both directions.
USD/JPY...98.45 is the weekly hold and pivot level (App 101.60 Futures). The Bots flushed out some stops over this level last night in thin Asian trading. Closing under this level is dollar bearish and will have us looking for another 2 figures. Yen tested that level twice last night with
100 pip rejections both times.
YCS...63.92 seems to be the app matching level to 98.45 USD/JPY
Commodities...
?
Brent? Oil...108.50 is the upside pivot. As long as this holds 108.00 look for higher prices.
Oil...(WTI) as overbought as this is, maintaining above the 106.80 level can lead to 109.35. I'm not looking to pick a high or fade as long as it remains above 106.00
Gold...shows a potential double top @ 1300 on the point & figure charts. new price action over this are is needed for higher.
SX...November Beans seem to have broken out a couple of days early. I'll take a look after the Pit session opens today.
General Comments or Valuable Insight
I'm very happy I kept my mouth shut yesterday. Sometimes it's enough to know what not to do. The Euro was a great example on Tuesday.
When you see a chart pattern that smells to high heaven often the best trade is to?you just leave it alone.
Everyone got blown out of their long dollar positions last night in early Asia, and?now I think it's time to pass on getting opinionated. I want to see how the Bonds trade in the U.S. session before saying or doing anything.
Once again, we've seen some big Wed-Thursday extremes all put in in Asian trading. Let the board play out into the U.S. openings before you start swinging today.
Short Term View...
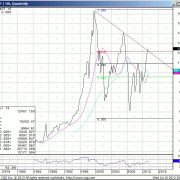
Spu/Bonds... still running the show so I thought I'd trot out the Long term chart.
Line charts are notoriously sloppy, however you do get a sense that we're at a big inflection?level. There is a lot more to go to get back to the 2007 high.
The Fed has let the market forces cool the Bond rally while keeping equities buoyant.
Mid June many loaded the boat long Bonds around 138.00, they're 4 points under water.
Point being I got out of my shorts @ 141 and participants have been talking about the big short but no one is.
Selling multi point rallies in the futures or buying the TBT around 71 will keep rewarding the patient trader.
Having pointed that out I'm not buying into a 100 point S&P rally. Let's let things settle down a bit.
For Glossary of terms and abbreviations click here.


