July 20, 2010 - How we are Ten Years Into the Bear Market
Featured Trades: S&P Composite Real (Inflation-Adjusted) Total Returns
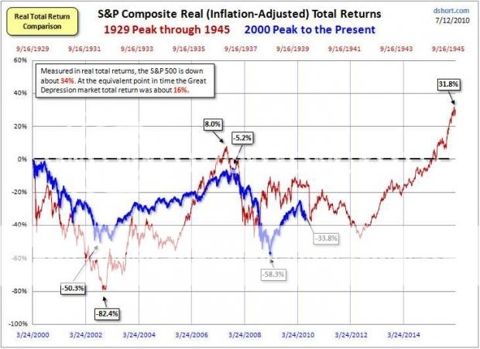
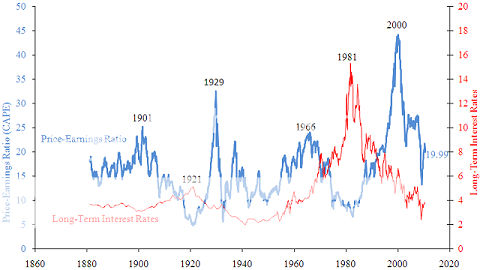
2) How we are Ten Years Into the Bear Market. As part of my never ending quest for truth, accuracy, and insight into the future direction of stock prices, I thought I'd pass on this chart from my friends at Business Insider showing that things are much worse than you think they are. It compares the current stock market performance with that seen after the 1929 crash, and makes the assumption that stocks peaked not in 2008, but in 2000. That means we are ten years into a bear market, not three. While our market is down during this period by 34% on an inflation adjusted basis, the previous Dark Age for stocks was down only 16% at this stage of the cycle. What's more, if you look at the second chart of Robert Shiller's cyclically adjusted PE multiples for the last 130 years, stocks are still over valued by 20%. The chilling conclusion here is that shares may have another decade of downside left, and the fair value for the S&P 500 is around 850. A momentum driven sell off, or another flash crash could easily take us lower. It is all just another excuse for me to avoid equities generally and to direct my advances towards commodities, currencies, precious metals, and emerging market stocks and bonds.


