July 21, 2010 - The Hard Numbers About Obama's Anti Business Campaign
Featured Trades:? (US ECONOMY), (BAC), (C), (MS),
(ANTI BUSINESS OBAMA)
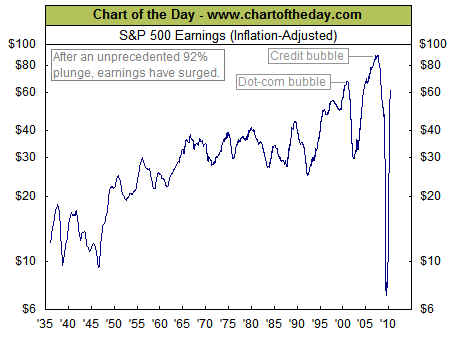
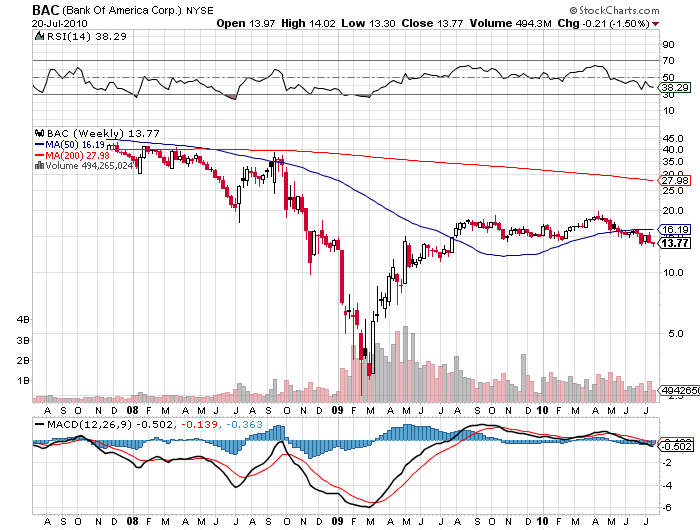
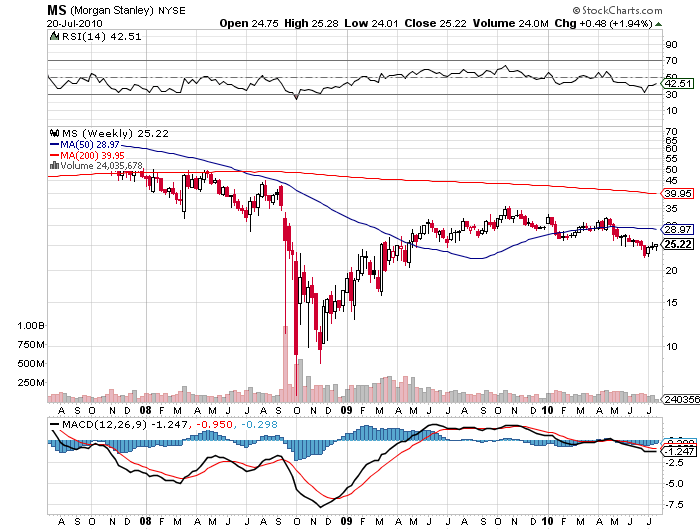
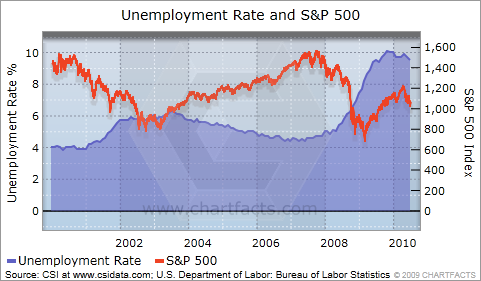
3) The Hard Numbers About Obama's Anti Business Campaign. I'm a numbers guy, OK? Give me a set of hard data, and I'm happy to draw my own conclusion. Save the argument, the persuasion, and the spin for someone else. You may have heard from the media lately that President Obama hates business, is anti business, and is derailing the economic recovery with his anti business policies. So I set out on a hunt for the hard numbers to support these assertions, and found the chart below of S&P 500 earnings going back to 1935. When the diligent former junior Senator from Illinois took office in January, 2009, inflation adjusted earnings, at $7/share, were the lowest in 75 years. They have since rebounded 857% to $60 a share, and most analysts are pegging $75 a share for 2011, close to an all time high. This has been the most rapid recovery of corporate earnings in the history of the country. So, I thought, this can't be right. What about Obama's relentless attacks on greedy banksters and Wall Street fat cats? So I hurried to www.stockcharts.com to see how these pariah institutions have fared. Since inauguration day, Bank of America's (BAC) stock has rocketed by 220%, while my alma mater, Morgan Stanley, is up a healthy 32%. I thought the financial reform bill was supposed to drive these people out of business. What about GDP? It must be terrible. But when I check the data it showed that the economy has grown during the last 18 months, and that GDP is actually at an historic peak. No matter how hard I searched, the only data I could find showed that business has prospered mightily under Obama, with many, like Citigroup (C), up 102%, rescued from the edge of bankruptcy. Then I had my Eureka moment. There has been so much talk about jobs lately that maybe the Department of Labor would help. Aha! Sure enough, the unemployment rate has plunged, and I mean absolutely crashed, from 7.8% to 9.5% (click here for the link at http://www.bls.gov/ ) . That explains why jobs have emerged as the central issue in this year's congressional races, how Sarah Palin has suddenly become a labor economist, and how Fox News has morphed into the 'Where Are the Damn Jobs' channel. Wait a minute! Didn't the Bush administration create only 1 million jobs in eight years, compared to 23 million by President Clinton? Wait a minute! This must be some sort of statistical anomaly. What about the talking heads on TV? Isn't employment supposed to be a deep lagging indicator? I'm confused. Help me out here, guys. I think I'll go back to looking at my numbers.


