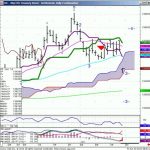
June 20, 2014 - MDT Pro Tips A.M.
While the Diary of a Mad Hedge Fund Trader focuses on investment over a one week to six-month time frame, Mad Day Trader, provided by Jim Parker, will exploit money-making opportunities over a brief ten minute to three day window. It is ideally suited for day traders, but can also be used by long-term investors to improve market timing for entry and exit points.
Current Positions
Short Euro??????????????? 136.31????????? 136.85 GTC????? 133.70
.......................................................................................
Today's Working Orders
BUY Euro @ 133.75 OCO 136.85 Stop GTC ( Good Until Canceled)
Sell 30 Yr. Sept Bond Futures "(USAU)(ZBU)" @ 136.09 GTC
.......................................................................................
Stocks...
IBM...double topped at the 50 day & 50 week mvg avg the first 2 weeks of the month. This one needs some patience for a sign of a good low.
It would be a better trade after month end than here for bottom fishing.
PCLN...is another name that needs some time.
ORCL...will be retesting the monthly ORH level from Feb @ 39.50 this A.M.
The preferred buy level would be 2 dollars lower @ trend 37.60. This bears watching over the next couple of days as this correction could be limited to a one day event.
TRN...Trinity Industries put in an ORH day. As long as this holds 84.20 on any weakness, look for this to remain firm into qtr end.
CHK...31.10 is resistance.
NEM...needs a close over 25.10 to confirm more upside.
BHP...needs a close today above 69.02 to think it won't have a pull back.
?
Bonds...
30 Yr. Bonds (U)...136.09-11 is the sell level.
TBT...puts in an ORH week with a close over 63.90.
64.25 is daily resistance.
FX...
Euro...136.74 is 200 DMA resistance
Euro needs a close under 135.30 to weaken.
?
Commodities...
Gold...support is 1300. Closing above 1328-30 resistance will lead to more upside. 1354 would be my next targeted level.
General Comments orValuable Insight
I would look for the first wiggle in the Indices today as an up move.
We'll be leaving a resting sell order in the 30 yr. Bonds GTC.
There is a chance that we get them off over the next week or two.
Less is more today. Nasd 100 is still caught between 3806 & 3754 on the longer term Point & Figure chart.
With 6 trading days left in the qtr. I'm not expecting much downside.
For Medium Term Outlook click here.
For Glossary of terms and abbreviations click here.


