June 6, 2011 - Charts Are Breaking Down All Over
Featured Trades: (CHARTS ARE BREAKING DOWN ALL OVER)
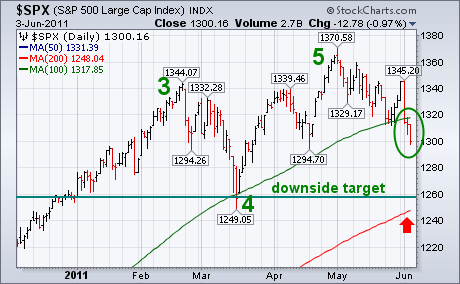
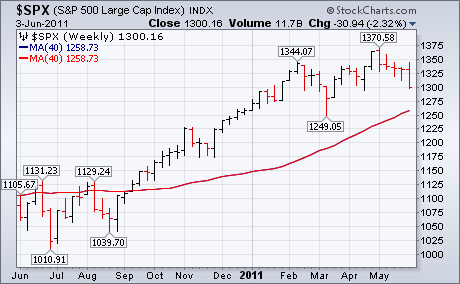
2) Charts Are Breaking Down All Over. My friends at StockCharts.com produced a wonderful series of charts today showing how destructive was the damage in risk assets, in general, and equities, in particular. The chip shot on the downside for the S&P 500 is now 1,260. With near panic among short term traders becoming endemic, we could hit that number very quickly. Furthermore, the long term trend line that has been supporting the bull market for 26 months is now at risk.
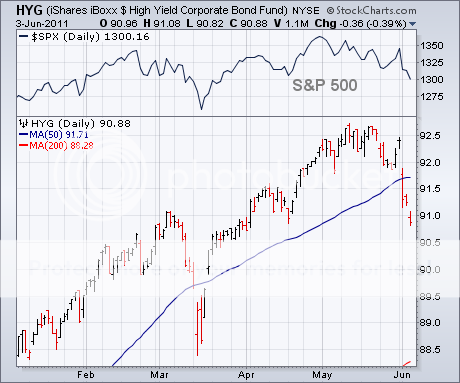
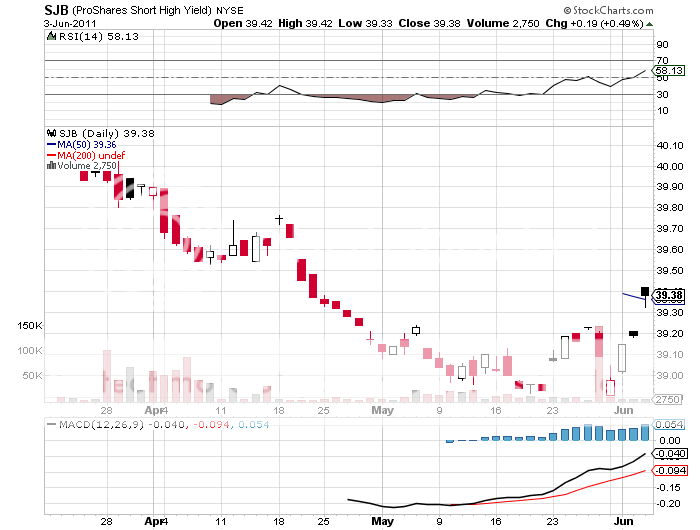
Also, take a look at the chart for the junk bond ETF (HYG), which is breaking down in a major way. You may recall that I argued that this asset class was also wildly over valued and due for a major round of selling (click here for 'Take a Ride in the New Short Junk ETF'). Those who followed my advice to buy the short junk bond ETF (SJB) have profited nicely, while the rest of the world has been going to hell in a hand basket.
Keep in mind that these are only charts, and that their utility has been somewhat diminished by the high frequency traders that now dominate the marts. But they do seem to be lining up nicely with my watershed piece that I published on April 22, 'Meet the 'RISK OFF' Portfolio' (click here for the piece)

-
-
-
-
The Breakdowns Are Everywhere


