March 13, 2014 - MDT Pro Tips A.M.
While the Diary of a Mad Hedge Fund Trader focuses on investment over a one week to six-month time frame, Mad Day Trader, provided by Jim Parker, will exploit money-making opportunities over a brief ten minute to three day window. It is ideally suited for day traders, but can also be used by long-term investors to improve market timing for entry and exit points.
Current Positions
Long BAC 14 March 18 Call???????????????????????????????? .11
Long CAT 14 March 100 Call? ? ? ? ? ? ? ? ? ? ? ? ? ? ??? .20
Orders are "stop on close" unless stated otherwise
.......................................................................................
Today's Working Orders
No working orders.
.......................................................................................
Stocks...?
GOOG will be a huge market tell over the next week. It was the first bell weather tech to put in an ORL pattern, which the broader market belatedly followed.
Yesterday's low was not low enough @ 1184. 1178.50 would have been the perfect low.
GOOG led the rally off the low in the Nasd 100 with a very quick 20 dollar jump.
1212-1215 will be a trouble zone for buying new strength. A close over 1219 negates the pattern.
The 1222.50 calls for Friday expiration looked reasonable on the close.
The 1240 calls March 14's for 3/22/14 exp are also worth a look.
DAX...9400 is 1st resistance. A close over 9500 will see Europe in rally mode.
Bonds...
30 yr. Bonds (H)... 132.31-133.03 is support and the downside pivot.
Bunds...143.49 is resistance.
?
FX...
AUD/USD...91.45-55 is resistance.
AUD/JPY...I guess 91.75 was a Bear trap! 93.42 is short term resistance.
KIWI...the wave counts come in around 85.80. This needs to digest.
it's getting a we bit overbought.
85.45 is the qtrly ORH #. If you're trading this currency have this tattooed to your screen.
A completion of that pattern tgt's 90 cents. "The game is afoot"
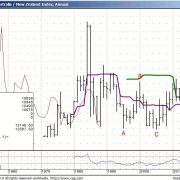
AUD/NZD.. is extremely oversold on all time frames out to the qtrly.
price action over 106.50 (2008 Low) could signal a trad able low.
A weekly close over 110.50 is needed to confirm any bottom and trend reversal.
There is still enough time in the qtr to sneak a peak at 104.34 (2005 Low).
The outlier is that it makes it all the way back to the beginning of trading in Jan. 1971 to print 99.89.
Yes, to the folks down under, this cross is getting ripe for a reversal.
We'll keep it on our radar. We'll let Mr. market tell us when it's time.
You don't want to be early on this type of trade.
Commodities...
OIL...Upside resistance is 100.28 the 200 day.
Gold...I haven't scrolled through the qtrly charts for a while, which shows room for another 80-100 dollars of upside.
Month end should prove very interesting in the metals.
Wheat (K)...6.96 is weekly resistance. A close over that area projects to 7.48.
Soybeans (K)...13.60-46 is support.
Grain futures expire tomorrow
General Comments orValuable Insight
Index Futures are beginning to force roll to June (M) by your quote providers..Make sure you know what you're trading!
Spreads differ as to instrument.
The Equity Indices have held off another swan dive. The plungers have been beaten back once again.
DAX, Nikkei & ASX all put lows in at number specific # sets, while the U.S. equity indices never got quite as low as one would've expected.
Look to the weekly options if you wish to buy upside.
Opening Range Time Frame Trading again today.
?
Short Term View...
Keep trading to make money. The opportunity will be in individual names.
Individual stocks look to be an easier read based off their own technical s.
We are positive Equities.
I'm accepting topic suggestions for my next webinar.
Please send your requests to themaddaytrader@gmail.com
January, 2014 MediumTerm Outlook-1st-qtr-2014/
For Glossary of terms and abbreviations click here.


