March 16, 2011 - What the Japanese Earthquake Means for the US Market
Featured Trades: (WHAT THE EARTHQUAKE MEANS FOR THE US MARKET)
2) What the Japanese Earthquake Means for the US Market. I went into the Japanese earthquake positioning for a big 'RISK OFF' trade, and it now looks like we are getting it in spades. The black swans are alighting.
So how much damage is the US in for?
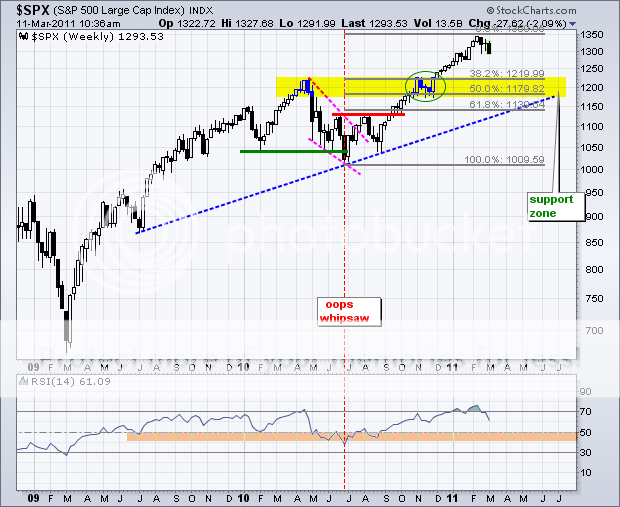
My bet is that the S&P 500 is going to get slapped around a few times, and may even get a severe spanking, but it is not taking a trip to the mortuary any time soon. Take a look at the chart below, which outlines a number of different support levels for the closely watched big cap stock index.
The nearest and most conservative of these appears at 1,220. This is a combination of a 38.2% Fibonacci retracement of the recent move up, banging into the April-November, 2010 double top. Below that, stronger support kicks in at 1180, 1130, and the August, 2010 low at 1010. In view of the 0.50% that has just been knocked off of the global economic growth as a result of the disaster in Sendai, the first target will be met within the next six weeks. That equates to about $124 in the ETF (SPY). That should sit well with my Macro Millionaire friends, who are currently long a (SPY) $128-$124 bear put spread that expires on April 17.
A 1220 bottom would give us a 9% correction from the February 20 top. That is a normal winter correction for the type of bull market we have been enjoying for the past two years. Keep in mind, we might see the last 30 points of this in a one day spike down, which may then immediately recover. Those looking for a major crash will have to wait until next year, or 2013 at the latest.
To get lower than that, we are going to need more bad news. Given the preponderance of black swans we have seen this year, I don't think that will be a problem. Don't forget, the Bernanke put and QE2 expire in 10 weeks, and the chances of a reprieve are about nil. That's when the sushi may really hit the fan.

-

