March 17, 2025

(INVESTORS ARE LOOKING FOR CLARITY AMID THE CHAOS)
March 17, 2025
Hello everyone
WEEK AHEAD CALENDAR
Monday, March 17
8:30 a.m. Empire State Index (March)
8:30 a.m. Retail Sales (February)
10:00 a.m. Business Inventories (January)
10:00 a.m. NAHB Housing Market Index (March)
Tuesday, March 18
8:30 a.m. Building Permits preliminary (February)
8:30 a.m. Housing Starts (February)
8:30 a.m. Import Price Index (February)
9:15 a.m. Capacity Utilization (February)
9:15 a.m. Industrial Production (February)
9:15 a.m. Manufacturing Production (February)
11:00 p.m. Japan Rate Decision
Previous: 0.5%
Forecast: 0.5%
Nvidia GTC on March 17-21, with keynote address March 18.
Wednesday, March 19
2:00 p.m. FOMC Meeting
Previous: 4.5%
Forecast: 4.5%
2:00 p.m. Fed Funds Target Upper Bound
Earnings: General Mills
Thursday, March 20
8:00 a.m. UK Rate Decision
Previous: 4.5%
Forecast: 4.5%
8:30 a.m. Current Account (Q4)
8:30 a.m. Continuing Jobless Claims (03/08)
8:30 a.m. Initial Claims (03/15)
8:30 a.m. Philadelphia Fed Index (March)
8:30 a.m. Existing Home Sales (February)
8:30 a.m. Leading Indicators (February)
Earnings: Nike, Micron Technology, Lennar, FedEx, Darden Restaurants
Friday, March 21
8:30 a.m. Canada Retail Sales
Previous: 2.5%
Forecast: -0.4%
This week investors will have one eye on the geopolitical landscape, and Trump’s relationships with Europe and other countries around the world, and the other on domestic data as it relates to the health of the U.S. economy.
The Retail sales report will reveal the temperature of the consumer – always a good indicator of the strength of the U.S. economy.
The Fed is widely expected to hold rates steady at its meeting this week. But it’s the post-meeting that will be interesting. Investors will be listening for any shifts in monetary policy because of the ongoing uncertainty stemming from the Trump administration, and the recent sluggishness in the economy.
Also, this week, Nvidia (NVDA) could get a kick along from the GPU Technology Conference (GTC). Investors are looking for Nvidia’s ability to keep delivering new chips at a faster pace than in the past. It’s a tall order! Investors will also be looking for details on Nvidia’s next chips called “Rubin”, named after Vera Rubin, the astronomer who discovered dark matter.
MARKET UPDATE
S&P500
After a tumultuous couple of weeks, the S&P500 has finally found some support around 5495/10. The market is very oversold, so there is potential for a bottom to form here for a few weeks.
Support = $5500/10 and $5435
Resistance = $5635/$5780
GOLD
Gold hit another new high, recently reaching $3005. If we look at the big picture, through an Elliott Wave lens, the rally from the Nov. low at $2537 is in its final upleg, which suggests a rising risk of an approaching multi-month top. So, even though we could get some more short-term upside in gold, investors need to be aware that a top is near. After a correction, gold will resume its bull market rally. Targets include $3,500, and $4000.
Support = $$2676/$2930/$2892
Resistance = $3005/$3030
BITCOIN
Bitcoin has been continuing its messy bottoming behaviour, reaching a recent low at 76.6k. In the big picture, Bitcoin’s movement is seen as a large correction with an eventual upside rally targeting new highs. Bitcoin could continue this ranging/basing for another week or two, and even touch lows below 76, though the extent and pace of the move will likely be limited. Bitcoin should not breach 60k, but if it does, it will most probably be a spike movement to test the Bitcoin bulls.
Support = $79.7 and $75.6 area
Resistance = $$87.6k/$88k
TRADES CORNER
AS I eventually expect bitcoin to rally in the short to medium term, I have been researching some options to play this rally. Many of you don’t own bitcoin, so the next best thing is to either own or do options on (IBIT) and (MSTR).
Below I have displayed a few alternatives option plays for (IBIT) and (MSTR). It’s up to you how many you do – you can place all of the trades, just one, or none of them, should you just want to observe the action. Also, the number of contracts is up to you – just choose a weighting that is comfortable for you, so you can sleep at night. Of course, by the time you enter any of these option trades, prices will probably have moved, so please trade accordingly.
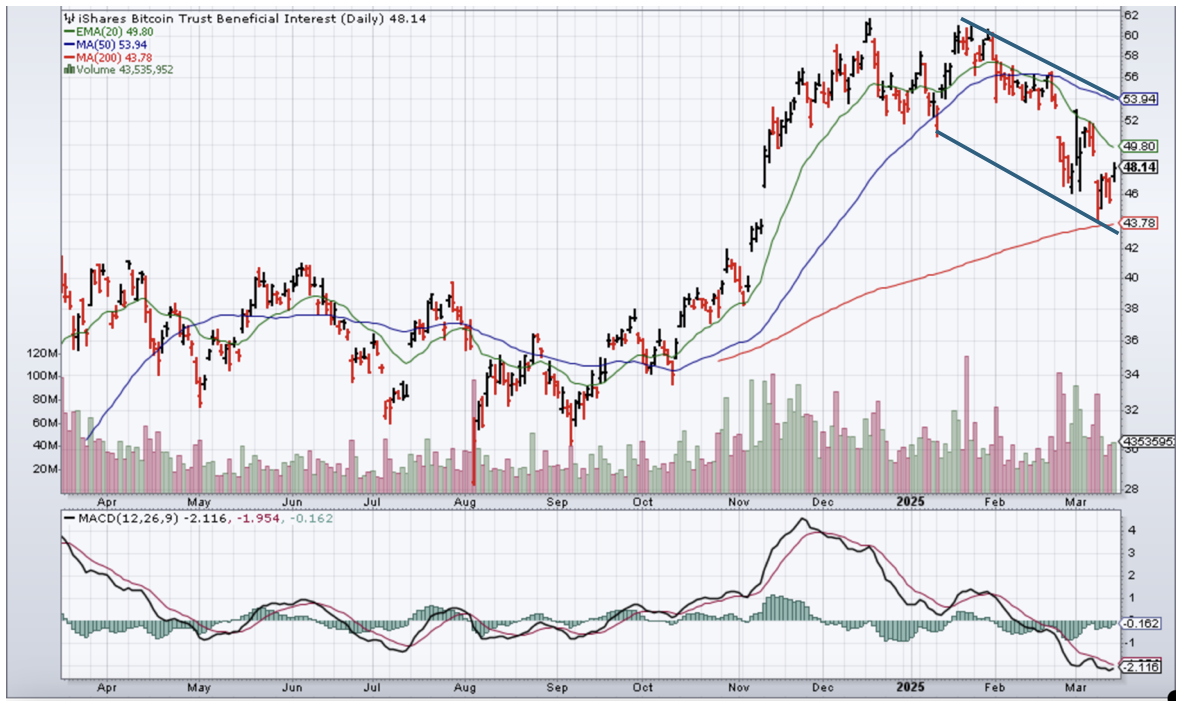
(IBIT) Price = $48.14
1/ Sell 1 May 16, 2025, (IBIT) $55 call
Buy 1 May 16, 2025, (IBIT) $50 call
Max Profit = $337
Max Loss = $163
Cost = $1.63
2/ Sell 1 June 20, 2025(IBIT) $65 call
Buy 1 June 20, 2025 (IBIT) $55 call
Max Profit = $815
Max Loss = $185
Cost = $1.85
3/ Sell 1 August 15, 2025 (IBIT) $70 call
Buy 1 August 15, 2025 (IBIT) $60 call
Max Profit = $837
Max Loss - $163
Cost = $1.63
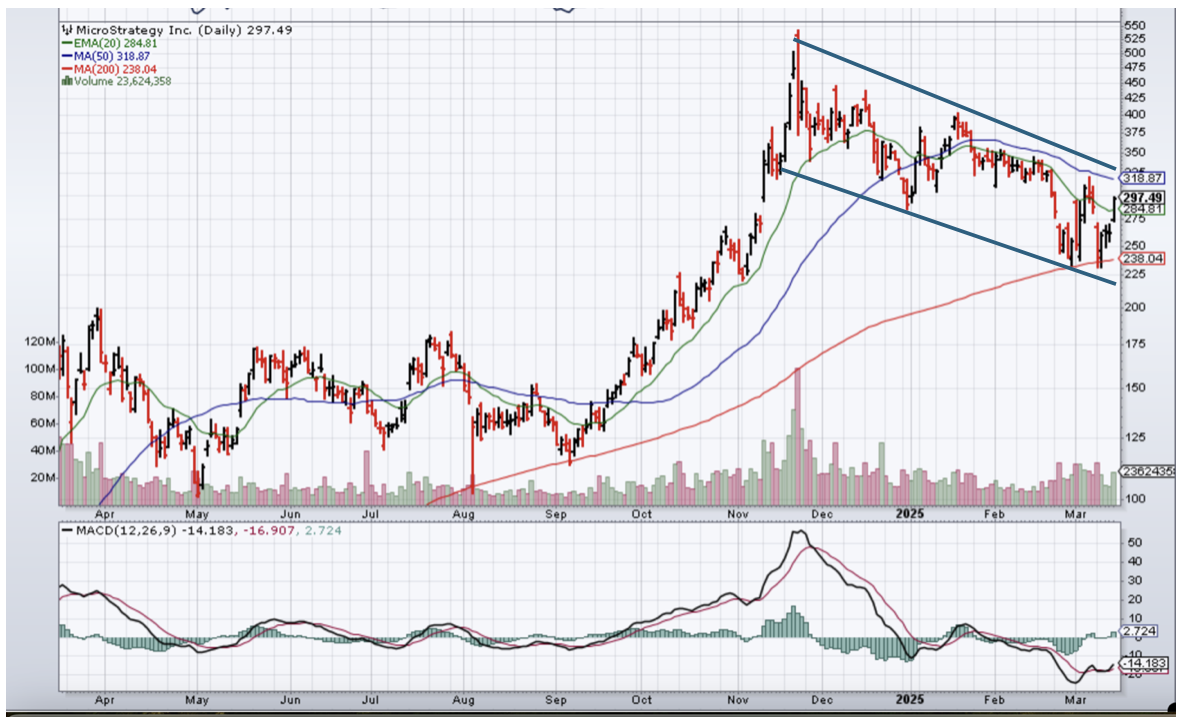
MicroStrategy (MSTR) Price = $297.49
Sell 1 May 16, 2025 (MSTR) $320 call
Buy 1 May 16, 2025 (MSTR) $310 call
Max Profit = $630
Max Loss = $370
Cost = $3.70
Sell 1 July 18, 2025 ((MSTR) $325 call
Buy 1 July 18, 2025 (MSTR) $315 call
Max Profit = $647
Max Loss = $353
Cost = $3.53
MicroStrategy Daily Chart
(IBIT) Daily Chart
QI CORNER


HISTORY CORNER
On March 17


SOMETHING TO THINK ABOUT


Cheers
Jacquie