March 28, 2014 - MDT Pro Tips A.M.
While the Diary of a Mad Hedge Fund Trader focuses on investment over a one week to six-month time frame, Mad Day Trader, provided by Jim Parker, will exploit money-making opportunities over a brief ten minute to three day window. It is ideally suited for day traders, but can also be used by long-term investors to improve market timing for entry and exit points.
Current Positions
No Current Holdings
Orders are "stop on close" unless stated otherwise
.......................................................................................
Today's Working Orders
No working?orders
.......................................................................................
Stocks...
VIX...needs above 15.15 to rally to 15.84. The weekly buy stops are at 16.40 with 16.64 being weekly closing resistance.
Nasd 100...3545-50 is today's support and the next inflection level.
The weekly breakdown level is 3576. Closing below here tgt's 3500, and then the February lows @ 3412
Nikkei...needs to sustain above 14,800 for higher. A close over 14,870 would confirm Wednesday's ORH pattern targeting 15,000.
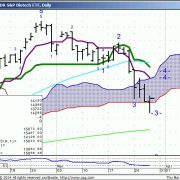
XBI...S&P Biotech Spider is trying to find footing. Resistance is @ 150.75.
?
Bonds...
30 Yr. ... caution back below 133.24-26. The Bonds can weaken below here.
FX...
Euro...137.16 is today's weekly mvg avg support.
EUR/AUD...149.85 is the monthly ORL #.
Any print near 147.90 should be deemed an exit zone the first time down. This is the 200 day mvg avg. and the cross would be oversold at this level.
Short Euro/Long Kiwi is another spread that looks to have reached the end of momentum. ( It's directionally challenged..meaning selling weakness looking for follow through is a bad idea)
USD/CAD...110 +- a few pips is lining up as a new pivot.
AUD/JPY...has had a big two week rally. 95.71 is macro resistance with resting buy stops above.
KIWI...as long as 85.45 holds on breaks the Kiwi will remain firm.
The short term wave count comes in around 88.00
Commodities...
Natgas... new strength over 4.60 resistance would target 4.85.
Gold...any weakness into the 1280's today could set up a bear trap the first time down.
New strength over 1297 ( today's 200 day) is needed for any rally to ensue.
Silver...price action over 19.80 should not be faded today. Silver could easily rally 30-40 cents.
Oil..looks like it could squeeze up close to 102.50. I would not look for any more than that today.
?
General Comments orValuable Insight
The U.S. Equity markets have been all about a correction in the NASDAQ high momo names, which have been sold in favor of pretty much everything else over the past 2 weeks.
Russia, Brazil, China & Mexico have all had big 2 week rallies led by their currencies appreciating against the dollar.
So much for listening to main stream financial media telling you different. They can't read a chart!
Copper is another example of their collective genius.
There is no downside unless we can convincingly close under 2.95.
Opening Range Time Frame Trading again today.
The medium term view for the second qtr comes out next week.
Short Term View...
Keep trading to make money. The opportunity will be in individual names.
Individual stocks look to be an easier read based off their own technical s.
We are Neutral Equities.
We've included our medium term view from the beginning of the year so you can get a sense of what's happened and where the markets are now.
January, 2014 MediumTerm Outlook-1st-qtr-2014/
For Glossary of terms and abbreviations click here.


