The Market Outlook for the Week Ahead, or Taking the Elevator Down
It is often said the markets take the escalator up and the elevator down. A thousand Dow points in three days? That’s like taking the elevator down from the 101st floor of the Empire State Building down to the basement in one shot.
Welcome to your new $30 billion tax, or about $90 per American per year. That will be the effect of the new 10% tariff increase on $300 billion worth of goods imported from China. Unfortunately, this comes on top of an existing $210 per American, bring the total bill due from the China trade war to $300 per person.
Clearly, the Chinese think they can get a better deal from the next president and are inclined to wait it out. This has been my base case since the trade war started 18 months ago.
It was one of the most frenetic, emotion-charged, and violent weeks of the year, with almost daily wild swings on a daily basis. This is the environment where hedge funds and newsletters like this one earn their pay.
The July Nonfarm Payroll Report came in at 164,000, keeping the headline unemployment report to 3.7%. Average hourly earnings grew by a hot 3.2% YOY. The previous two months were revised down by 41,000. Overall, it was a disappointing report.
Manufacturing has been especially weak all year, adding only 16,000 jobs in July and averaging 8,000 jobs a month all year. The headline charge into the services economy continues. Retail lost 3,600, the sixth consecutive monthly decline. The strength was in Professional Services, up 31,000, Health Care at 30,000, and Social Assistance at 20,000.
The broader U-6 “discouraged worker” structural unemployment rate dropped from 7.2% to 7.0%, a new cycle low.
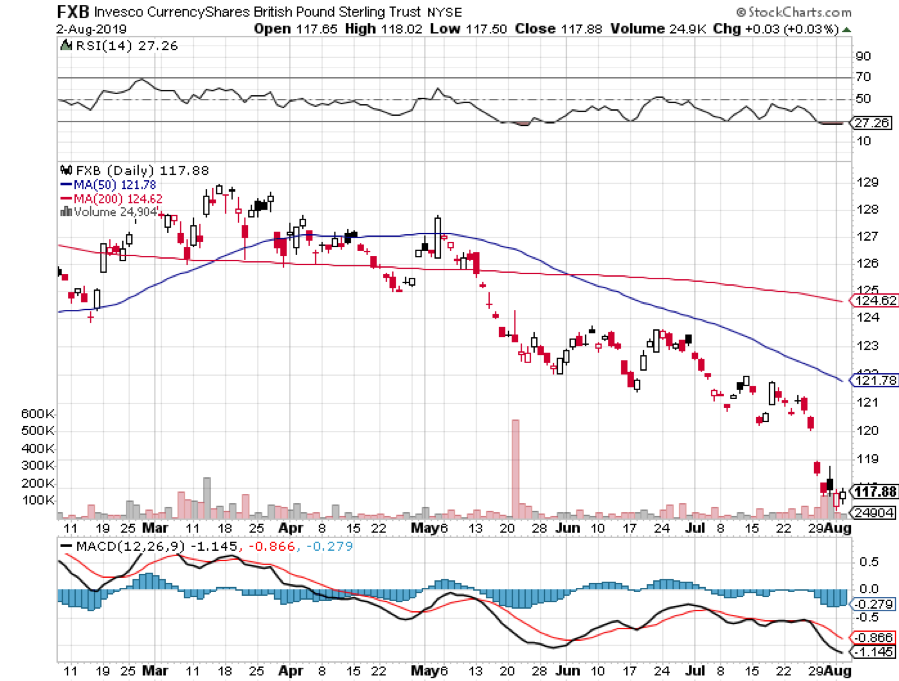
The British Pound (FXB) crashed by 1%, as the harsh reality of a hard Brexit looms. That’s because Boris Johnson, the pro Brexit activist, was named UK prime minister and filled his cabinet with anti-EC doormats. It virtually guarantees a recession there and will act as an additional drag on the US economy.
The end result may be a “Disunited Kingdom”, with Scotland declaring independence in order to stay in the EC, and Northern Ireland splitting off to create a united Emerald Island. The stock market there will crater and the pound will go to parity against the greenback.
Home Price Gains are Still Shrinking, from a 3.5% to a 3.4% annual gain in May, according to the S&P Corelogic Case Shiller National Home Price Index. The Median Home Price hit a new high of $285,700. That can’t buy you a parking space in San Francisco. This is removing a major leg from the economy.
Las Vegas saw the biggest increase at 6.4%, followed by Phoenix at 5.7% and Tampa at 5.1%. Shrinking price gains in the face of falling interest rates is a classic pre-recessionary indicator.
Apple hurdled a low bar, with an upward forward guidance delivering a 5% pop in the stock. Revenues rose 1% to $53.8 billion, while profits dropped 7%. The future looks bright on the eve of 5G iPhones. Hardware drops to less than half of sales for the first time. Services revenues jump to 21% of the total.
China is still a drag. Amazingly, Apple only bought $17 billion worth of its own stock last quarter against a commitment of $100 billion. So why are analyst “BUY” ratings at a decade low? Maybe it's because threats of retaliation in the China trade war are hanging over Apple like a sword of Damocles.
It took only three words to kill Wall Street. Confusion reigns. “Mid Cycle Adjustment” was how Fed governor Jay Powell described Wednesday’s 25 basis point interest rate cut, the first in 12 years, absolutely what the market didn’t want to hear. That implies that the Fed is “one and done,” and that there will be no more interest rate cuts in this economic cycle.
The president added insult to injury piling abuse on his own appointee, further eroding confidence in the independence of the Fed. A truly data dependent Fed wouldn’t have budged last week.
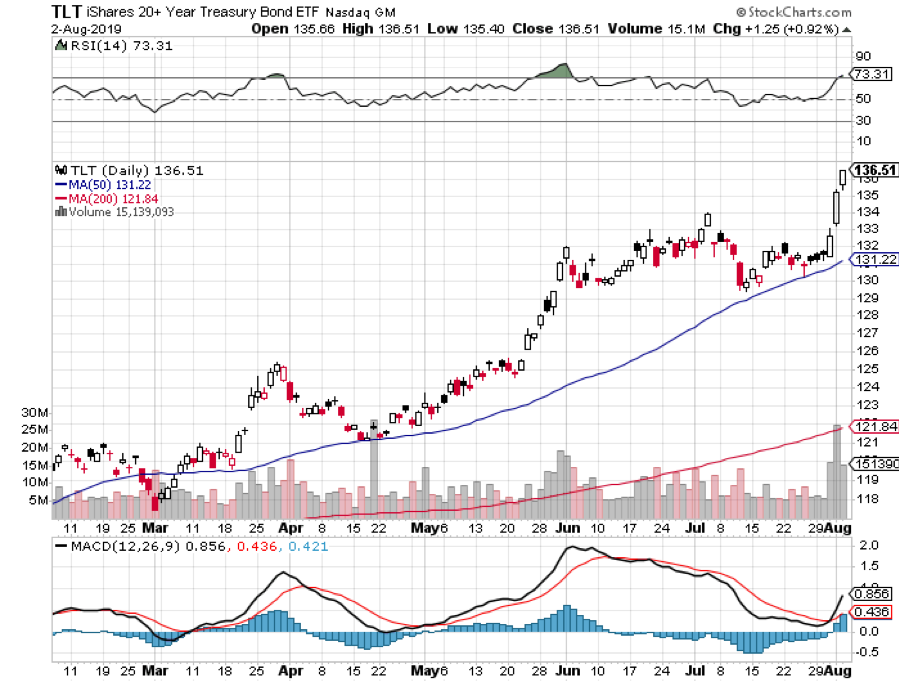
Bonds soared on “one and done.” Higher rates for longer give a new lease on life for the fixed income markets everywhere. Since 2008, major central bank balance sheets have exploded from $3 trillion to $16 trillion, and there is nowhere better for this mountain of money to go but the ten-year US Treasury bond.
Yields have smashed the four-year low at 1.82% and are headed to 1.40% by yearend. The market is wildly overbought for now on the back of an instant three-point rally, so keep buying those dips. Next up is the century low in rates.
Oil crashed 8% on increased global recession fears, in the worst plunge in four years and one of the biggest swan dives in history. The strong dollar doesn’t help either. I have recommended that investors avoid energy like the plague all year and it has worked like a charm. Long term, it’s going out of business anyway, so I don’t even want to trade it here.
Retailers got destroyed on the China news, with stocks down 6%-12% across the board. Best Buy (BBY) did a 12% swan dive. This will be the stick that broke the camel’s back for a lot of retailers already hanging on by their fingernails. Some 42% of US apparel, 69% of footwear, and 84% of accessories come from China.
Squeezed by Amazon on one side and administration China policies on the other, this will spell the death of retail. It looks like we’re going to have to go barefoot this winter. Thank goodness there’s global warming. The death spiral was further confirmed by the weak jobs figures in retail this morning.
I went into the week 100% in cash, giving me the dry powder to pursue the short side aggressively. I always tell followers that cash is a position, that it has option value, and this was a classic example of how well that can work.
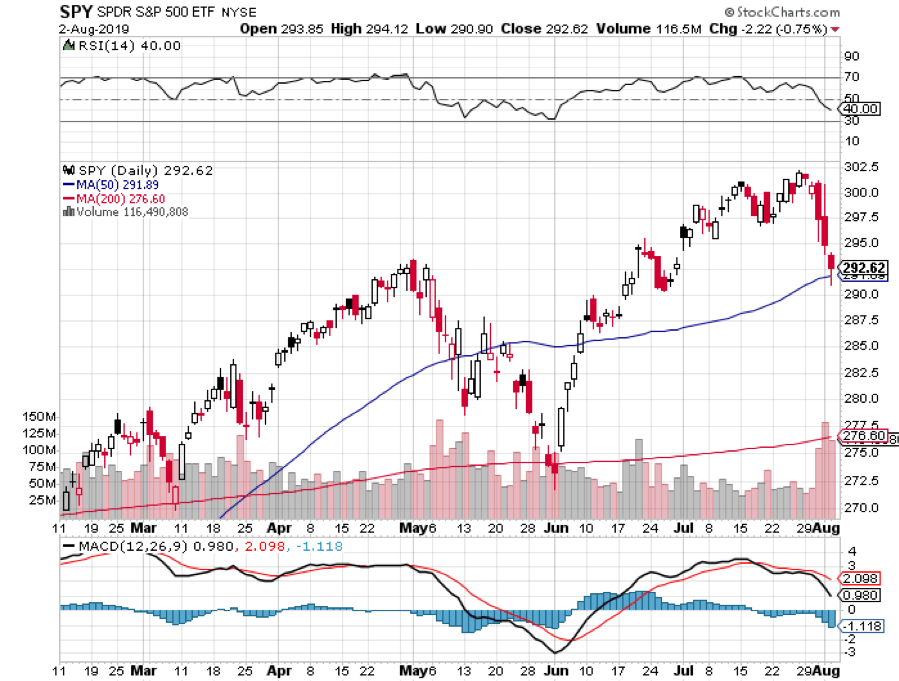
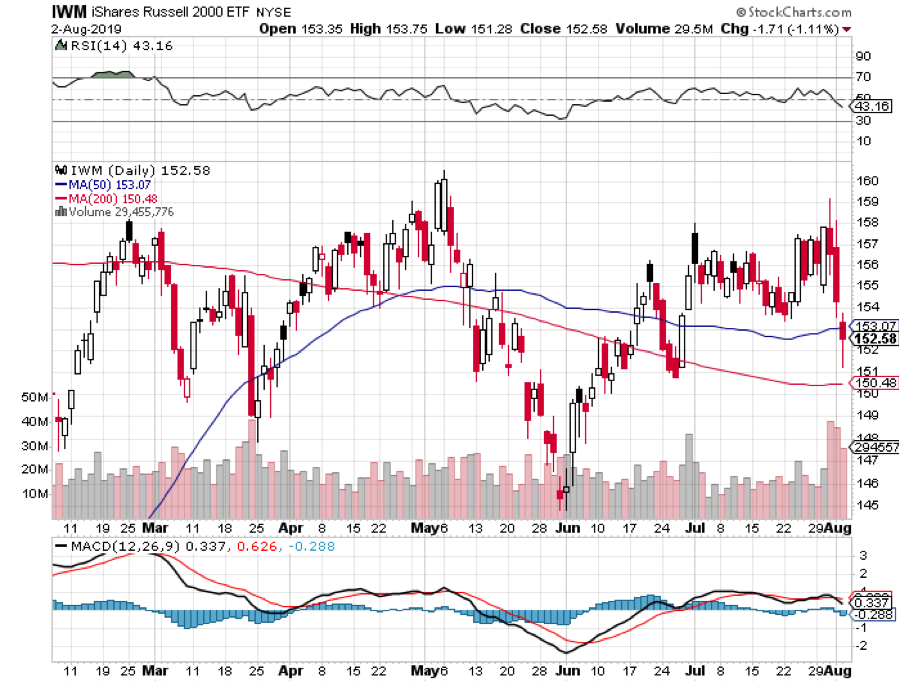
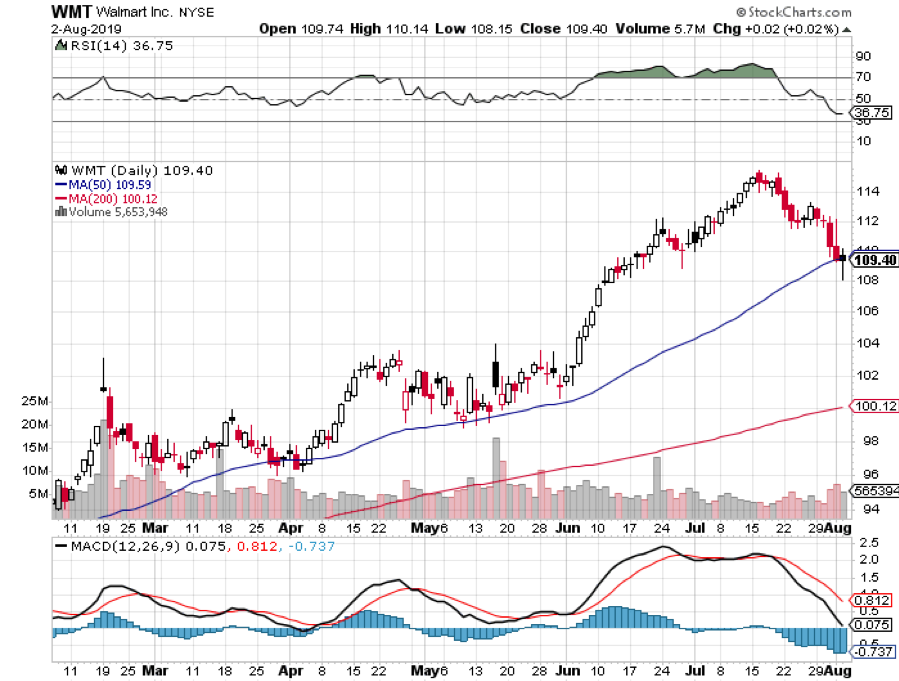
The second I heard about the China tariff increase, I went pedal to the metal and increased my shorts from 0% to 40%, against 60% cash. My current shorts include the S&P 500 (SPY), US Treasury bonds (TLT), the Russel 2000 (IWM), and the giant retailer (WMT).
I see August as the best short selling opportunity of the year. I put out my first shorts the day after the Fed rate cut. My Global Trading Dispatch has hit a new all-time high of 320.30% and my year-to-date shot up at +20.16%. A robust earned a robust 1.83% so far in August, and 4.78% since I went back into the market from Zermatt, Switzerland three weeks ago.
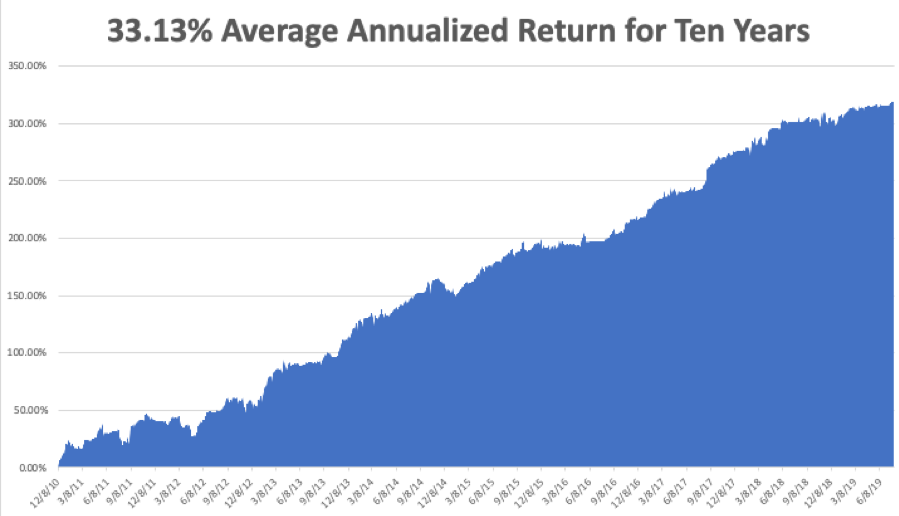
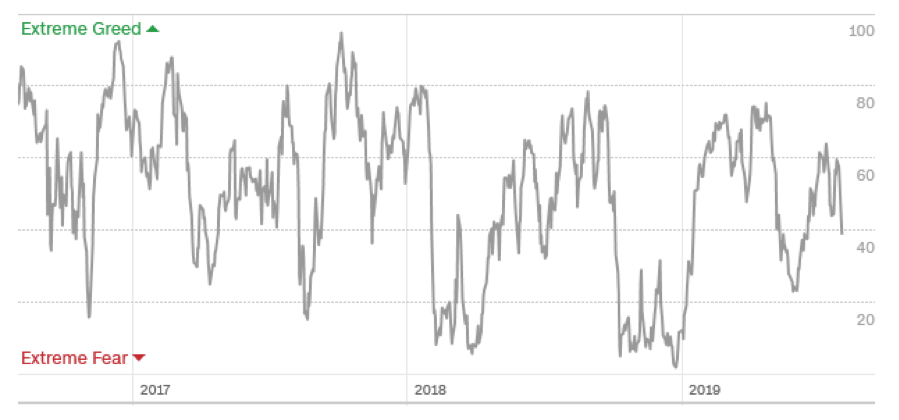
My ten-year average annualized profit bobbed up to +33.13%. My Mad Hedge Market Timing Index saw one of the sharpest declines in its history, plunging from 65 to 23 on only two days. We could even be back to “BUY” territory by the end of next week.
The coming week will be a feeble one on the data front. Believe it or not, it could be a quiet week.
On Monday, August 5 at 2:00 PM, the July ISM Non-Manufacturing PMI is out.
On Tuesday, August 6 at 2:00 PM, the June JOLTS Jobs Openings report is published.
On Wednesday, August 7, at 8:30 AM, June Consumer Credit is released.
On Thursday, August 8 at 8:30 AM, the Weekly Jobless Claims are printed.
On Friday, August 9 at 8:30 AM, July Core Purchasing Price Index is printed, an inflation indicator.
The Baker Hughes Rig Count follows at 2:00 PM.
As for me, believe it or not, I have not been to the beach this year. As a native Californian, that is near high treason. So I am loading up the old Tesla with an ice chest, boogie boards, and kids and headed to nearby Stinson Beach in Marin County. I’m going early to beat the traffic and will take my usual short cuts I learned while living there eons ago.
Surf’s up!
Good luck and good trading.
John Thomas
CEO & Publisher
The Diary of a Mad Hedge Fund Trader


