Market Outlook for the Weeks Ahead, or The Dumb Money Finally Comes Out of the Woodwork
Yikes, holy smokes, and sweet mother of Mary!
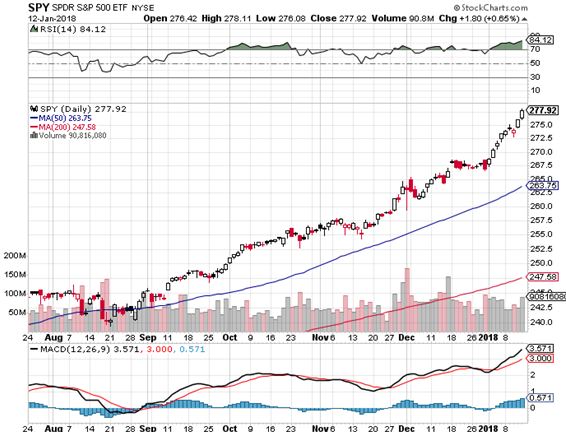
The S&P 500 (SPY) is up an eye-popping, gob smacking 4.2% so far in 2018, making up a third of my original 12% target for the entire year. Even more incredible is that it has gained nearly 10% in 30 days. If we continue to appreciate at this rate we will see 75,000 by yearend!
Which means we won't. But it is fun to run the numbers. Remember that NASDAQ soared 80% in the final eight months of the Dotcom Bubble until April, 2000 before its final downfall. It took 17 years to match that high again.
Action like this can only be explained by one new factor. After being absent for a decade, the "dumb money" is finally coming back into the stock market after a decade long hiatus.
"Dumb money," as all seasoned veterans know, are individual retail investors gun shy of stocks, thanks to the disastrous outcome of the 2008-09 crash. They have a bad habit of only buying at market tops.
Even after a blockbuster 2017, which saw 20% index gains and many 80% individual stock melt ups, that kept a death grip on their cash. Flows into equity mutual funds last year were virtually flat, while bond funds saw $200 billion worth of net inflows.
Ma & Pa appear to be pouring their money into index funds, which has the effect of focusing buying into the largest cap stocks, like the FANG's. Of course, the evidence is only anecdotal so far, gleaned from checks with the big brokers. We won't get the hard numbers that the dumb money has arrived until next month.
Good luck getting through to your broker though. If you call Interactive Brokers (IBKR) all you get is a recoding telling you how to execute a Bitcoin trade.
All the hoopla over the passage of the tax bill seems to have finally melted the ice. They were not alone.
Big tech (XLK) and oil companies (XLE) also seem to be major buyers of their own stock, front running a new round of buybacks financed by $2.6 trillion of repatriation, also enabled by the tax bill.
All asset classes are drinking the Kool-Aid.
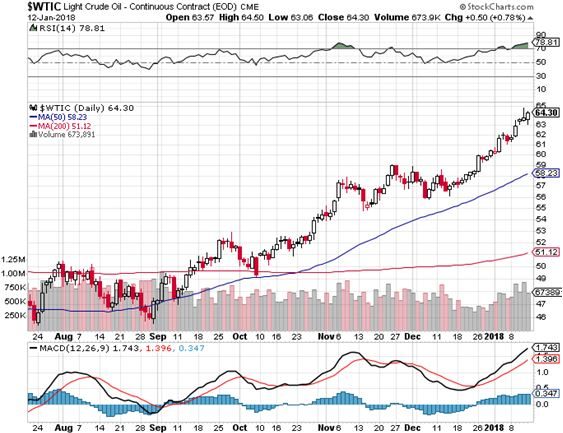
Oil (USO) is also fast approaching my yearend target of $65, and seems hell bent on kissing $70. US oil supplies have seen the fastest ten week draw down in history, some 39 million barrels, thanks to extreme cold and accelerating economic growth. And it looks like the weather is about to hit again.
Some analysts are now forecasting $80 if the current OPEC production quotas are honored through yearend, once considered a long shot.
It's a good thing I rushed you out a research piece two weeks ago pounding the table that oil companies like Occidental Petroleum (OXY) would see the fastest earnings growth of 2018.
Even forlorn gold (GLD) has caught a bid, as the stock market wealth effect spills into other asset classes. I'll get around to writing a piece on how that works one of these days.
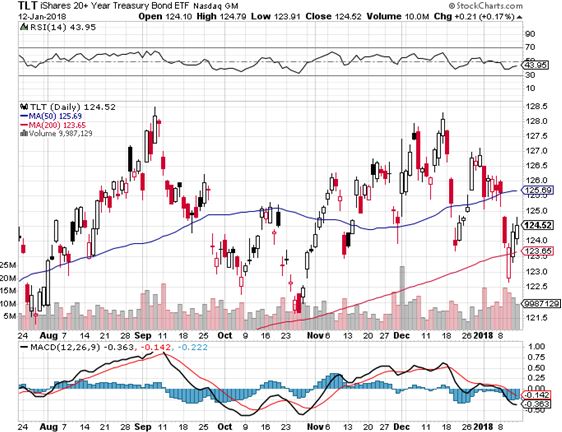
Those who have been waiting nine years for a crash in the bond market may be finally getting their wish. US Treasury bonds committed some key technical damage to their long term charts.
The 25-year trend lines for the two and ten year bonds entered bear market territory. I shot out a Trade Alert to sell short the (TLT), (or buy the (TBT)), the day it happened.
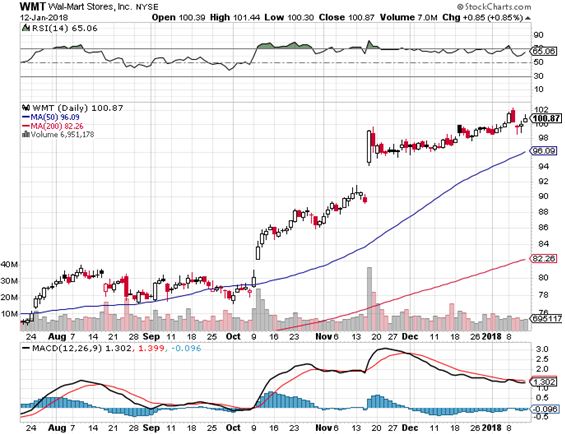
The most important announcement of the week was misread by almost everyone. Walmart (WMT), with 1.5 million employees the largest private employer in the US, said it was raising its minimum wage from $9 to $11 an hour as a result of the tax bill.
Here's what really happened. A massive fiscal stimulus on top of the lowest unemployment rate in a decade is creating a severe shortage of workers. As the largest employer and lowest payer, (WMT) will be the first to feel this. Some $2 an hour, or 22.22%, is a big jump. It means that real, card carrying inflation is on the way.
Walmart credited the tax bill for the move to score points with an administration that is at war with it on other fronts. The big one is the overwhelming share of imports from China and Mexico the company sells in its stores, which the administration is trying to cut back.
These days, EVERYTHING, is political.
Friday's December CPI Report was still muted at a 2.1% annual rate. But break down the numbers, and they show that the prices of manufactured goods (the past) have been falling for five years, while the prices of services (the future) are roaring at a 3% plus annual rate. And the overall rate may not be so muted when the Walmart figures his in three months.
As my UCLA Math professor used to lecture me, "Statistics are like a bikini. What they reveal are fascinating, but what the conceal is essential."
Conclusion: SELL MORE BONDS!
We are now into Q4 earnings season so those should be the dominant data points of the coming weeks.
On Monday, January 15, the markets are closed for Martin Luther King Jr. Day.
On Tuesday, January 16 at 8:30 AM EST the December Empire State Manufacturing Survey is published. Citigroup (C) reports earnings.
On Wednesday, January 17, at 9:15 AM EST, we obtain December Industrial Production. Bank of America (BAC) and Alcoa (AA) report earnings.
Thursday, January 18 leads with the 8:30 EST release of the Weekly Jobless Claims. At the same time December Housing Starts are Announced. The weekly EIA Petroleum Status Report is out at 11:00 AM EST.
On Friday, January 19 at 10:00 AM we learn December Consumer Sentiment, which should be very positive.
Then at 1:00 PM, we receive the Baker-Hughes Rig Count, which lately has started gone ballistic. Schlumberger (SLB) and Kansas City Southern (KSU) report earnings.
As for me, we finally got some decent snow at Lake Tahoe, so I'll be up there pounding the slopes in the morning when its cold, and diving into my research in the afternoon. I'm still trying to fix leaks in the roof from last winter's crushing 70 feet of snow.
When the kids are glued to their iPhones upstairs, I will be investigating the considerable assets of one Stormy Daniels. Clearly nature was kind, very kind. I understand the rest of the country is doing the same thing.