May 16, 2014 - MDT Pro Tips A.M.
While the Diary of a Mad Hedge Fund Trader focuses on investment over a one week to six-month time frame, Mad Day Trader, provided by Jim Parker, will exploit money-making opportunities over a brief ten minute to three day window. It is ideally suited for day traders, but can also be used by long-term investors to improve market timing for entry and exit points.
Current Positions
Long QQQ 23 -??May 14 - 87??Put ? ? ??.41?
Orders are "stop on close" unless stated otherwise
.......................................................................................
Today's Working Orders
This order has changed from yesterday!?
Sell? your remaining Long 23 May 87 QQQ Put position When the QQQ trades 86.05
?"OCO" .41 stop.?
?We're either exiting the position @ the market? when the QQQ trades? 86.05 or @ breakeven (.41 stop)??...either or/One Cancels the Other.?
?This will Close this Trade
.......................................................................................
Stocks...
Spu's...a close under 1854.50 puts in an ORL week.
DAX...9600 is today's support and the closing downside pivot.
Below, 9470 ish is the next level to look for a bounce.
EWZ...the rally in Brazil looks tired. A close under 48.48 can lead to close to a 10% decline.
EWA...has a potential double top on the monthly chart. While Australia is still on the top of the country's we'd like to invest in, this too can correct.
Only a couple of closes over 27 changes the pattern.
EWP...is coming into trend support around 40.65
?
Bonds...
30 yr. Bonds...136.20 is support.
?
FX...
USD/JPY...yesterday elected the weekly buy stops just below 101.35 to potentially put in a monthly double bottom in the Dollar ( High In the Yen).
A close under 101.42 today puts in an ORL week in the Dollar/YEN ( Higher Yen Futures).
The natural correlation would be to assume more Risk off in the Nikkei.
The positive correlation the Yen had with the U.S. Equity Indices has not held up well this year, but it's worth keeping on your radar.
When the U.S. Equity indices go Risk off the Yen does not break.
101.20 (98.80 Futures) is the 200 DMA resistance.
Yen needs over 102.75 (97.30 Futures) to weaken.
Commodities...
Gold & Silver keep stopping at resistance and rolling over.
The longer term point & figure chart still shows a $50 range trade in the Gold. We're waiting for a range breakout to trade it.
General Comments orValuable Insight
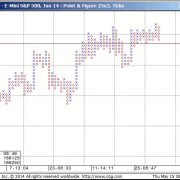
The Long term Point & Figure in the Spu's shows a breakdown under 1854.50 close.
We've just had another day and a half break to nowhere.
When I heard the mindless muts on CNBC opining the end of the world I almost sold the rest of my Puts in the QQQ.
Just a word of caution to all the plungers out there, Spu/Bonds stopped just above the 200 DMA again on yesterday's low in the Indices.
This will be a tough level to penetrate. Let the market do the work and don't press weakness. The weekly pattern is friendly to the Bears.
Sell rallies-not breaks.
Only closing under that level will trigger a wider sell off!
I'm out of here momentarily for a conference. This is it for today.
The OCO order below in the Puts will make sure you don't give all the money back.
Opening Range Time Frame Trading again today.
?
Short Term View...
Keep trading to make money. The opportunity will be in individual names.
Individual stocks look to be an easier read based off their own technical's.
S&P 500 Futures
Gold
For Medium Term Outlook click here.
?For Glossary of terms and abbreviations click here.


