Global Market Comments
April 17, 2019
Fiat Lux
Featured Trade:
(DECODING THE GREENBACK),
(WHAT ABOUT ASSET ALLOCATION?)
(TESTIMONIAL),
Global Market Comments
April 17, 2019
Fiat Lux
Featured Trade:
(DECODING THE GREENBACK),
(WHAT ABOUT ASSET ALLOCATION?)
(TESTIMONIAL),

Asset allocation is the one question that I get every day, which I absolutely cannot answer.
The reason is simple: no two investors are alike. The answer varies whether you are young or old, have $1,000 in the bank or $1 billion, are a sophisticated investor or an average Joe, in the top or the bottom tax bracket, and so on.
This is something you should ask your financial advisor, if you haven’t fired him already, which you probably should.
Having said all that, there is one old hard and fast rule which you should probably dump. It used to be prudent to own your age in bonds. So if you were 70, you should have had 70% of your assets in fixed income instruments and 30% in equities.
Given the extreme over valuation of all bonds today, and that we probably just entered a 30-year bear market, I would completely ignore this rule and own no bonds.
Instead you should substitute high dividend paying stocks for bonds. You can get 4% a year or more in yields these days, and get a great inflation hedge, to boot. You will also own what everyone else in the world is trying to buy right now, high yield US stocks.


Global Market Comments
April 16, 2019
Fiat Lux
Featured Trade:
(WHY YOU WILL LOSE YOU JOB IN THE NEXT FIVE YEARS,
AND WHAT TO DO ABOUT IT),
(BLK)
Global Market Comments
April 15, 2019
Fiat Lux
Featured Trade:
(MARKET OUTLOOK FOR THE WEEK AHEAD, OR QE IS BACK!),
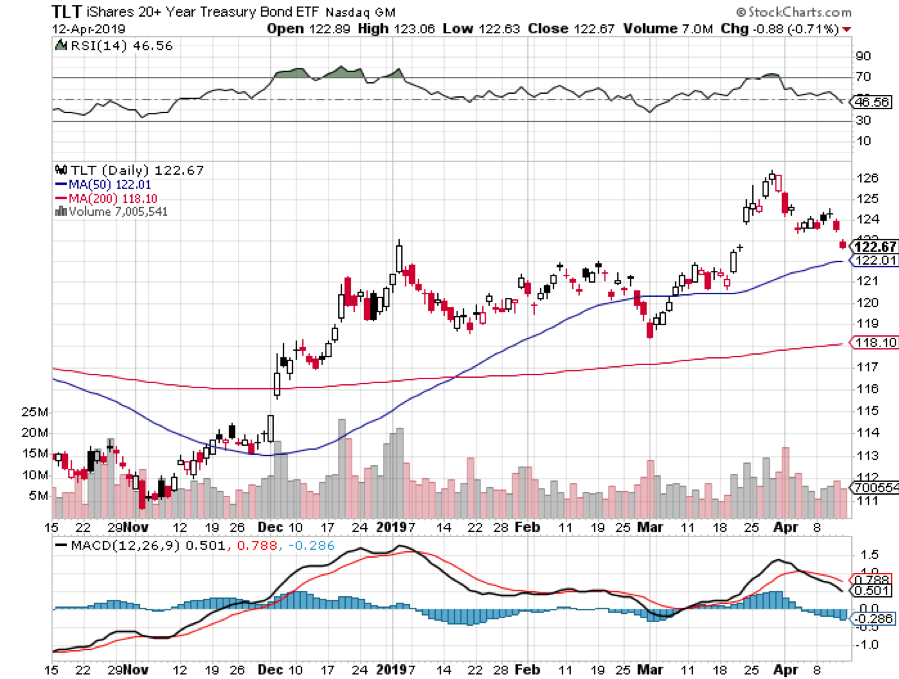
(SPY), (TLT), (TSLA), (DIS), (FCX), (GOOG), (MSFT), (AMZN)

Let me warn you in advance that I am only going off drugs long enough to write this newsletter.
This year’s flu has finally laid me low and let me tell you it is a real killer. Perhaps it is my advanced age that has magnified its effects. Then I developed an allergic reaction to the flu medicine I was taking. For a couple of days there, I was looking like the Michelin Man.
However, I did have a lot of time to read research. And what I learned was sobering.
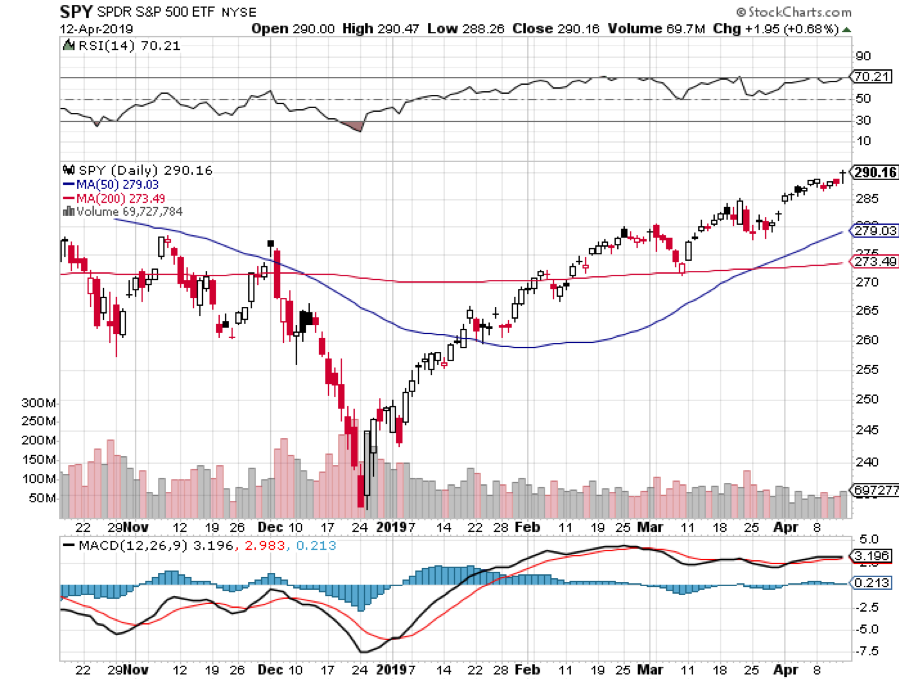
For a start, we are fully back to a quantitative easing market. In one fell swoop, the Fed went from an expectation of four interest rate hikes in 2019 to none. By ending quantitative tightening early, it has cut the amount of cash it is withdrawing from the financial system from $4.3 trillion to only $1.5 trillion.
The Fed is in effect reflating the bubble one more time. And what do you do in a QE-driven economy. YOU BUY EVERYTHING! This explains why stocks, bonds, commodities, and energy have all been marching upward in unison this year even though that is supposed to be theoretically impossible.
Yes, the decade long liquidity-driven bull market may have another leg up to go.
A higher high inevitably leads to a lower low. The trades you are executing now may be akin to picking up pennies in front of a steam roller. We are clearly planting the seeds of the next financial crisis. But for now, the pain trade is clearly to the upside.
Those of who who traded through the dotcom bubble are seeing déjà vu all over again. Huge money-losing tech companies are now floating IPOs on a daily basis. This too will end in tears, which is why I have recommended to followers to avoid all of them. This is a sucker’s game.
There is a cloud behind this silver lining. After a ballistic 21.43% move in the Dow Average in four months, markets are trading as if risk is a thing of the past. The euphoria is here and complacency rules. That means the number of new possible low risk/high return trades out there has fallen to zero.
There is another cloud to worry about. The more excess stimulus the Fed provides the economy now, the fewer resources it will have to get us out of the next recession, which might be only a year off. As a result, everyone is long but extremely nervous. They are still participating in the party but are standing next to the exit door. Pent up volatility is building like a volcano ready to explode.
The other great revelation is that markets have been trading extremely short term in nature, only one quarter ahead of what the real economy is doing. So, a stock market meltdown in Q4 2018 discounted a collapsing GDP growth in Q1 2019 of a 1% rate or less. That is down 80% from a year ago peak.
The ultra-strong market in Q1 is anticipating an economic rebound in Q2, After that, who knows?
That’s why I am moving both of my trading portfolios for Global Trading Dispatch and the Mad Hedge Technology Letter to 100% cash positions in the coming week.
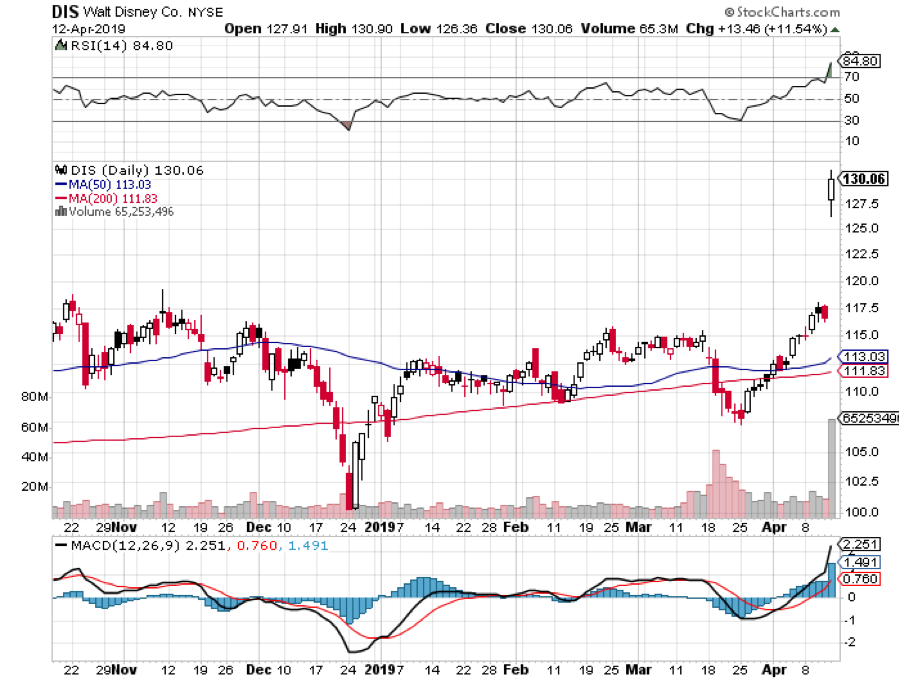
Last week was the week when Walt Disney (DIS) morphed from being a has-been media stock hobbled by a failing holding in ESPN to a dynamic company that is suddenly taking over the world. The reward was an eye-popping 25% move in three weeks, which we caught.
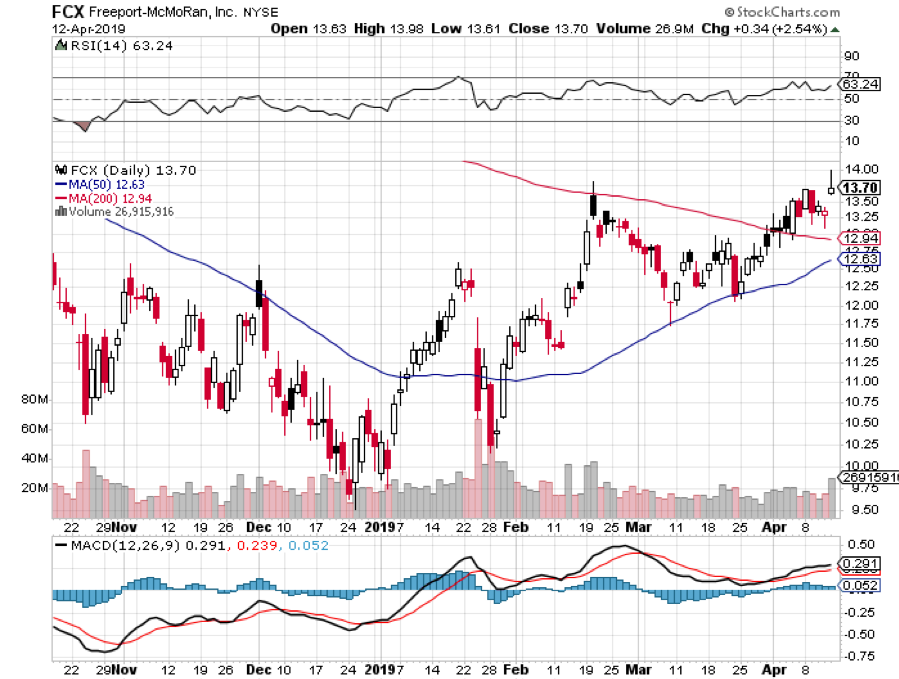
Copper demand is rocketing, off of soaring global electric car production. Each vehicle needs 22 pounds of the red metal, and 4 million have been built so far. That number reached 5 million by June. Take a second bite of the apple with (FCX) as well.
General Electric got slaughtered again, with an earnings downgrade from Morgan Stanley. It will take years to sort out this mess. Avoid (GE).
The 30-year fixed rate mortgage plunged to 4.03% and may save the spring selling season for residential real estate.
Apple Topped $200. It looks like the market is finally buying the services story. Stand aside for the short term. It’s had a great run, up 42% from the December low. I’m waiting for 5G until I buy my next iPhone, probably next year.
The Mad Hedge Fund Trader hit a new all-time high briefly, up 15.46% year to date, and beating the pants off the Dow Average. Good thing I didn’t buy the bearish argument. There’s too much cash floating around the world. However, my downside hedges in Disney and Tesla cost me some money when I stopped out. I was late by a day.
We are taking profits on a six-month peak of 13 positions across the GTD and Tech Letter services and will wait for markets to tell us what to do next.
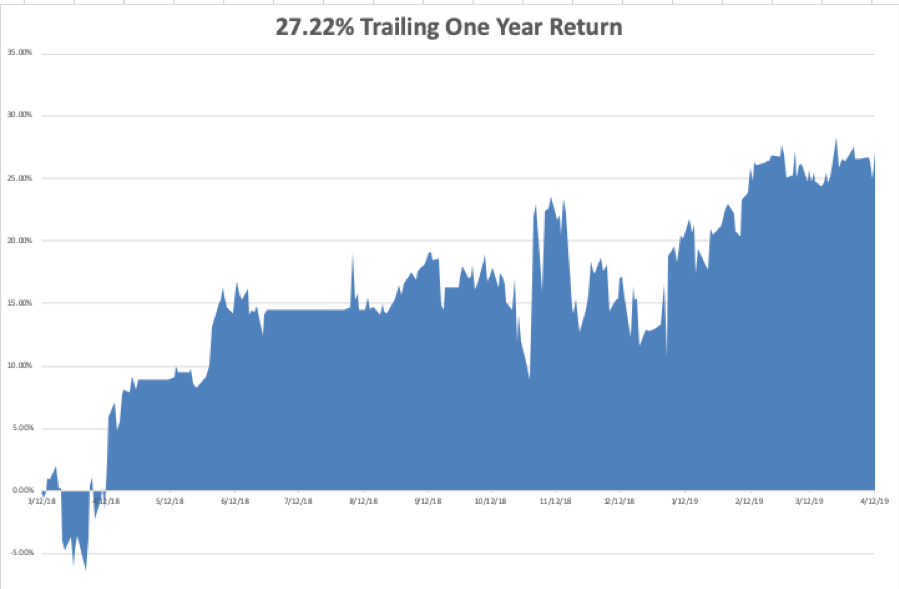
April is so far down -1.50%, as my downside hedges in Tesla (TSLA) and Disney (DIS) cost me some sofa change. My 2019 year to date return retreated to +13.92%, paring my trailing one-year return back up to +27.22%.
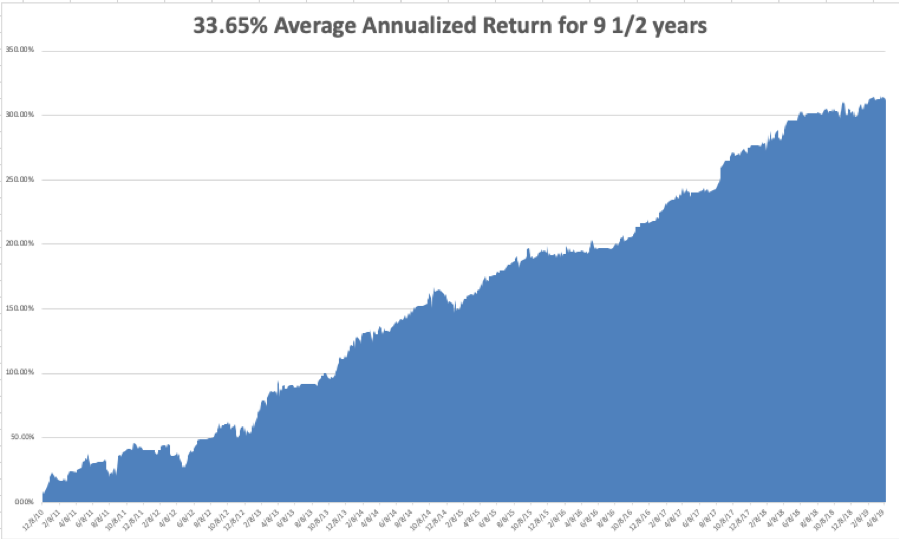
My nine and a half year return backed off to +314.06%. The average annualized return appreciated to +33.65%. I am now 100% in cash.
The Mad Hedge Technology Letter has gone ballistic, with an aggressive and unhedged 30% long which expires this week. It is maintaining positions in Microsoft (MSFT), Alphabet (GOOGL), and Amazon (AMZN), which are clearly going to new highs.
It’s going to be a dull week on the data front after last week’s fireworks.
On Monday, April 15 at 8:30 AM, we get the April Empire State Index. Citibank (C) and Goldman Sachs (GS) report.
On Tuesday, April 16, 9:15 AM EST, we learn March Industrial Production. Netflix (NFLX) and IBM (IBM) report.
On Wednesday, April 17 at 2:00 PM, we get the Fed Beige Book Indicators. Morgan Stanley reports (MS).
On Thursday, April 18 at 8:30 the Weekly Jobless Claims are produced. At 10:00 AM EST, we obtain the March Index of Leading Economic Indicators. American Express (AXP) reports.
On Friday, April 19 at 8:30 AM, the markets are closed for Good Friday.
As for me, I am staying planted in my bed reading up on research and watching HBO until I kick this flu. After that, I should be good for the rest of the year.
Good luck and good trading.
John Thomas
CEO & Publisher
The Diary of a Mad Hedge Fund Trader

Global Market Comments
April 11, 2019
Fiat Lux
Featured Trade:
(THE UNITED STATES OF DEBT),
(TLT), (TBT), ($TNX),
Global Market Comments
April 10, 2019
Fiat Lux
Featured Trade:
(A NOTE ON OPTIONS CALLED AWAY),
(TLT),
(NOTICE TO MILITARY SUBSCRIBERS)
Global Market Comments
April 9, 2019
Fiat Lux
Featured Trade:
(ABBVIE’S BATTLE FOR ARTHRITIS DOMINANCE),
(USING MOMENTUM STOCKS TO CALL THE MARKET),
(MTUM)
You would think that a company with 60% of the arthritis market would see a soaring stock price. But you would be wrong.
Based on its 2019 performance to date though, AbbVie (ABBV) seems to be on the brink of a disaster. From an impressive 54% gain way back in 2017, the giant pharma stock started to lose ground this year with its share price falling by double-digit percentages. Nevertheless, staunch believers of this stock remain steadfastly optimistic about the company's future.
Here are pretty good reasons why they might be right.
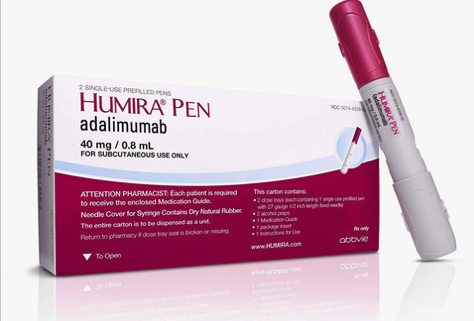
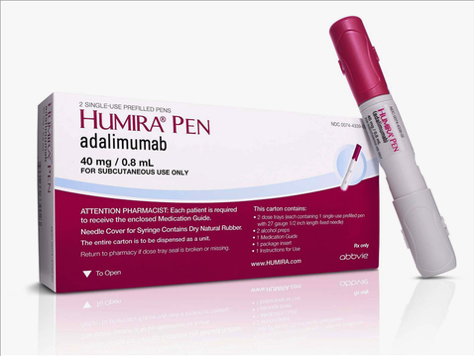
A lot of investors have been wary of AbbVie due to the company's dependence on their blockbuster drug, Humira, which is marketed as a treatment for rheumatoid arthritis, psoriatic arthritis, ankylosing spondylitis, Crohn's disease, ulcerative colitis, psoriasis, hidradenitis suppurativa, uveitis, and juvenile idiopathic arthritis. Since AbbVie derives 60% of its total revenue from the sales of this drug, it's understandable why its shareholders are getting nervous over its declining performance in the market along with the emergence of competitors across the globe.
Surprisingly, AbbVie isn't the least bit worried about Humira.
One of the main reasons for their confidence in Humira's continued dominance in the market is the fact that biosimilar drugs won't be available in the US until around 2023. Given that two-thirds of Humira's sales or roughly $20 billion of its global profits come from the American market, this timeframe gives AbbVie a couple more years to rake in profits from its top drug. In fact, Humira is projected to keep earning as much as $15 billion up until 2024.
Notably, AbbVie has been labeled as a ruthless competitor with its latest move to mark down Humira by up to 89%. This "market poisoning" tactic, as its critics would dub it, has resulted in exits from a number of competitors and would-be competitors aiming to target the Dutch market as well. Hence, Humira might just be able to assert a renewed monopoly in the European nation via their aggressive discounts.
On top of that, AbbVie has lined up a couple of potential blockbuster drugs to take the baton from their beloved Humira. Plaque psoriasis drug Risankizumab along with rheumatoid arthritis treatment Upadacitinib are anticipated to boost AbbVie’s revenues this year as well.
In fact, both treatments are expected to gain FDA approval this year. These drugs, which are estimated to bring in incremental yearly sales of approximately $10 billion, are expected to pick up additional approvals to cater to other autoimmune diseases as well. Using a back-of-the-envelope calculation to add these two potential blockbuster drugs, therefore, puts AbbVie’s incremental risk-adjusted sales at around $35 billion by 2025.
Meanwhile, the company’s other promising products such as blood cancer treatments Imbruvica and Venclexta as well as endometriosis drug Orilissa are doing good in the market.
AbbVie has been exploring the possibility of expanding the indications for Venclexta to cover chronic lymphocytic leukemia (CLL), multiple myeloma, and acute myeloid leukemia (AML). As for Orilissa, this drug is slated to become yet another blockbuster product for AbbVie as it attempts to win approval for the treatment of uterine fibroids. Should Orilissa succeed in this, AbbVie would be poised to become one of the leading companies in the women's health category.
With all these developments and consistent sales from AbbVie, the company is anticipated to post an earnings per share of $2.05 by the next earnings report. If that happens, then the figures would indicate a 9.63% YOY growth for the company.
In managing my portfolio, I always bear in mind the wise words of Warren Buffett: "If you aren't willing to own a stock for 10 years, don't even think about owning it for 10 minutes." At the moment, AbbVie is sold at a bargain with shares trading at lower than eight or nine times its expected earnings. Looking at the company’s pipeline and history of aggressively protecting its moneymaking drugs, it’s clear that AbbVie is poised to provide a significant boost in anyone’s portfolio in the future.
Buy AbbVie on the next market selloff.
Hardly a day goes by without a reader asking me which indicators I follow when determining my impeccable market timing.
The short answer is that there are hundreds, and the 50-year accumulation updates real-time 24/7 in my head.
However, there is one in particular indicator that is worth mentioning today. That would be the performance of momentum stocks.
Momentum stocks are shares that deliver a larger move in price, or beta, than the market as a whole.
They tend to be the shares of high growth companies that deliver a reliable stream of positive earnings surprises.
In fact, they have earned a large following of traders, known as ‘momentum investors.”
Call them the canaries in the coal mine.
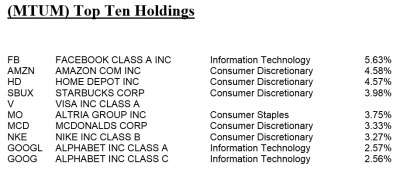
Look at the list of top ten holdings below, and you will find many that you know and love, and are often the subject of Mad Hedge Fund Trader Trade Alerts.
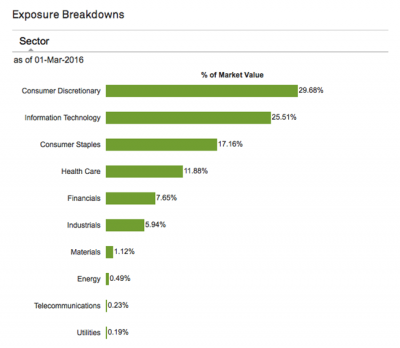
Momentum stocks are attractive because they substantially outperform a more sedentary index, like the S&P 500 (SPY).
Momentum stocks can be a great leading indicator for the stock market as a whole.
When momentum stocks take off like a scalded chimp, it is a good idea to adopt a “RISK ON” approach towards all of your asset selections.
When momentum stocks fail to reach new highs, it is a warning signal that the party is about to end and “RISK OFF” assets are about to gain favor.
This is why I always keep a close eye on momentum stocks when assembling my own trading book.
There is one really easy way to follow momentum stocks and that is to watch the iShares MSCI USA Momentum Factor ETF (MTUM) like a hawk.
The (MTUM) seeks to track the performance of an index that measures the performance of 122 U.S. large and mid-capitalization stocks exhibiting relatively higher momentum characteristics than the main market before fees and expenses.
This portfolio is then rebalanced every six months to reflect new market trends and to deep six the losers.
If you want to see how well this works, just take a look at the chart below.
The (MTUM) is particularly attractive because its 0.15% expense ratio is the lowest among the several offerings in the marketplace.
The fund currently has $8.56 billion in assets, so the institutional community takes it seriously.
The trailing 30-day SEC yield is only 1.31%, reflecting the fact that many of its holdings are non-dividend paying technology and health care stocks.
To learn more about the details of the (MTUM) please click here.
And what are momentum stocks telling us right now?
That they have just had an incredible three-month run and are long overdue for a rest.
Just thought you’d like to know.