Global Market Comments
January 24, 2019
Fiat Lux
Featured Trade:
(FROM THE FRONT LINES OF THE TRADE WAR),
(AAPL), (AVGO), (QCOM), (TLT),
(HOW THE MAD HEDGE MARKET TIMING ALGORITHM TRIPLED MY PERFORMANCE),
Global Market Comments
January 24, 2019
Fiat Lux
Featured Trade:
(FROM THE FRONT LINES OF THE TRADE WAR),
(AAPL), (AVGO), (QCOM), (TLT),
(HOW THE MAD HEDGE MARKET TIMING ALGORITHM TRIPLED MY PERFORMANCE),
“First you get the exam, then you get the lesson. You learn after the mistakes you make,” said technical analyst Carter worth about options trading.

Global Market Comments
January 23, 2018
Fiat Lux
Featured Trade:
(PLAYING THE SHORT SIDE WITH VERTICAL BEAR PUT SPREADS), (TLT)
(WHY TECHNICAL ANALYSIS DOESN’T WORK)
(FB), (AAPL), (AMZN), (GOOG), (MSFT), (VIX)

Global Market Comments
January 22, 2019
Fiat Lux
Featured Trade:
(THE MARKET FOR THE WEEK AHEAD, or WHY I LOVE THE STOCK MARKET),
(SPY), (TLT), (MSFT), (CRM), (AMZN), (FXE)
(HOW TO EXECUTE A VERTICAL BULL CALL SPREAD),
(AAPL)


I love working in the stock market.
Not only can it be entertaining, it can be downright hilarious. All of the talking heads on TV who were ultra bearish on the December 24 Christmas Eve Massacre are now hyper bullish, stumbling over each other trying to buy back the shares they sold 20%-30% lower.
January is turning into a mirror image of December. Last month you never got the rally to sell into. This month you can’t get a decent dip to buy into. The worst December in history was followed by the best January in 30 years with the mere turning of a page of the calendar.
I suspected as much was coming. That’s why I lurched from 10% to 60% invested during the first few days of 2019. All that’s left now is to take profits.
We got a particularly nice 336-point gap up in the Dow Average ($INDU) on Friday with rumors of progress on the China trade talks. However, those who bought on such speculations over the past nine months have all been badly burned.
A few weeks ago, the biggest threat to the market was failure of the China trade talks and a new government shutdown. Now, with prices 3,250 points, or 15% higher, the biggest threat to the market is SUCCESS of the China trade talks and the END of the government shutdown. They could trigger a huge “buy the rumor, sell the news” market move.
And what if stocks rise virtually every day this month as they did during January a year ago? It could get followed by the February we saw last year which served up a horrific selloff.
Like a hot water heater with a corroded safety valve, pressure is building up in the stock market and it is just a matter of time before it explodes. The Volatility Index (VIX) has just halved from $36 to $17. The only question is whether the next big move will be to the upside or the downside.
Don’t get too bullish now. A ton of bad economic news will hit the market in February. China slowdown, European crash, Brexit, what’s not to hate?
Don’t forget that the deadline for the completion of the trade talks is March 1.
Special persecutor Robert Mueller could also drop his report on the market at any time. Just when you think that things can’t get any worse, they do so, in spades.
If nothing gets done, you can expect another Christmas Eve Massacre, except this time it will come nine months early. It could set up the double bottom for the entire correction.
On the other hand, if everything gets resolved all at once, you can count on share prices taking off to the upside and challenge the old highs. And it might all happen on the same day.
We started out the week discovering that Newmont Mining bought Goldcorp for $10 billion to create the world’s largest gold miner. That’s important because another classic sign of a long-term bottom for the barbarous relic is when the miners start taking over each other. I’ve seen it all before.
This was the week when economic data ceased to exist unless it comes from private sources. Entering the fifth week of the government shutdown, we are all now flying blind.
US Core Inflation rose only 2.2% YOY, after a miniscule 0.2% gain in December. Don’t count on that pay rise anytime soon. All your company’s money is going to share buybacks instead.
Apple’s Asian suppliers reported terrible numbers. iPhone prices in China were cut. Apple is also cutting back on hiring. Fewer iPhone sales mean fewer people are needed to make them. I think I’ll keep my Apple short position.
PG&E went Bankrupt in order to keep the lights on in the face of $30 billion in potential wildfire liabilities. It’s the second time in 20 years. Thank goodness for my solar panels. Power prices are about to spike up big time and I’m a net supplier to the grid.
Netflix raised prices and the stock soared. Their monthly take is jumping by 13%-18%. (NFLX) shares are now up by 50% since Christmas Eve. The Walking Dead and House of Cards just got more expensive.
Brexit went down in flames with a crushing 432 to 202 loss in the UK parliament, the worst in 100 years. The opposition tabled a vote of no confidence which failed by only ten votes, barely heading off a general election. Next to come is a new referendum on Brexit itself which will go down in flames. Buy the British pound (FXB).
What does the end of Brexit mean for the Global economy? It strengthens Europe, prevents Italy, Greece, Portugal, and France from leaving the European Community, preserves NATO, and stops the Russian hordes from overrunning Western Europe. Croissants will be cheaper in London too. That’s all.
The December Fed Beige Book came in moderate. “Trade war” was mentioned 20 times but “government shutdown" comes out only once. Inflation is low but companies can’t pass price increases on to consumers. Labor shortages are showing up everywhere, but with few wage increases. The auto industry is flatlining.
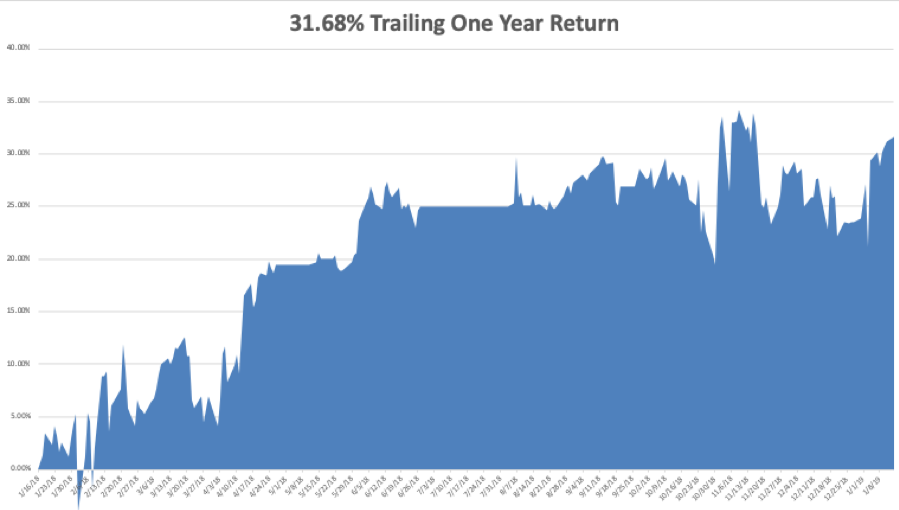
My January and 2019 year to date return exploded to +5.29%, boosting my trailing one-year return back up to +31.68%.
My nine-year return climbed up to +306.19%, just short of a new all-time high. The average annualized return revived to +34.00%.
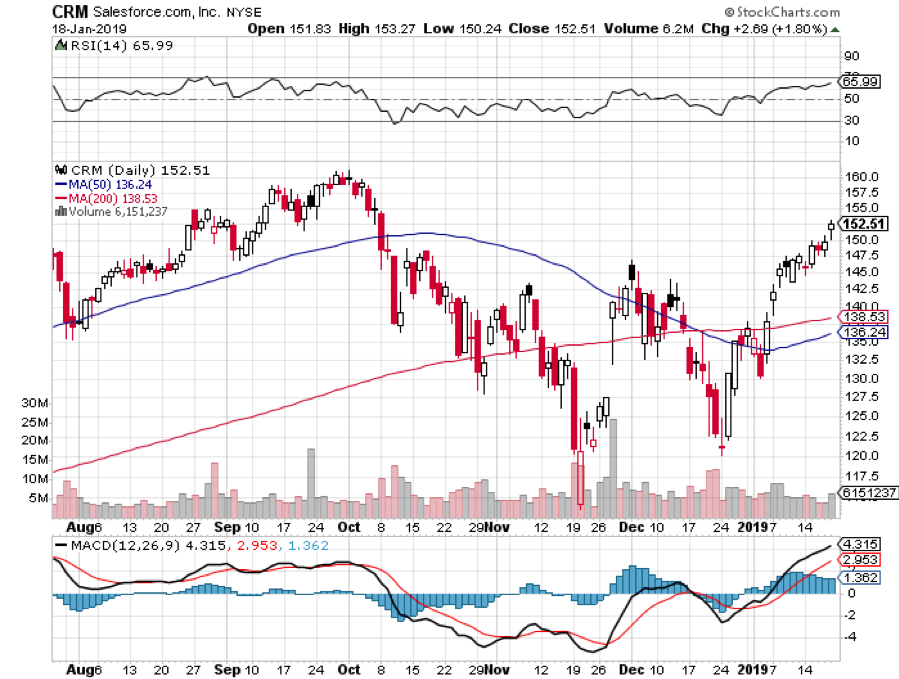
I took profits on one of my big tech longs in Salesforce (CRM) which maxed out the gains in my options position. I love this stock and will be back in there again on the next dip.
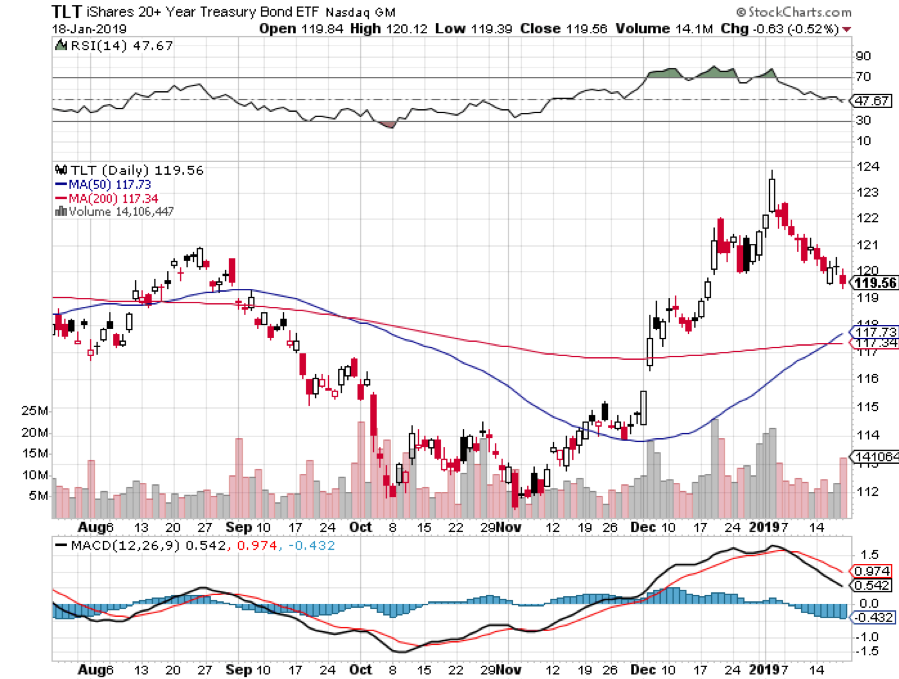
I am keeping my option positions in Microsoft (MSFT) and Amazon (AMZN) to take advantage of the time decay over the four day weekend. I cashed in half of my short position in the bond market (TLT), taking advantage of the recent 4 ½ point decline there.
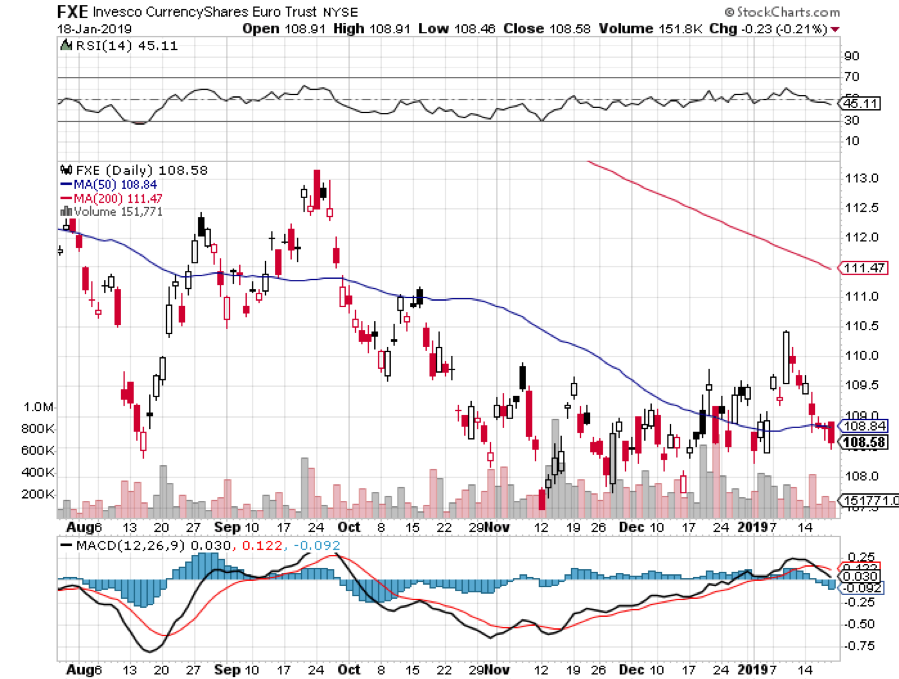
My long position in the Euro (FXE) survived the failure of Brexit and a no-confidence vote in Britain. It continues to bounce along the bottom.
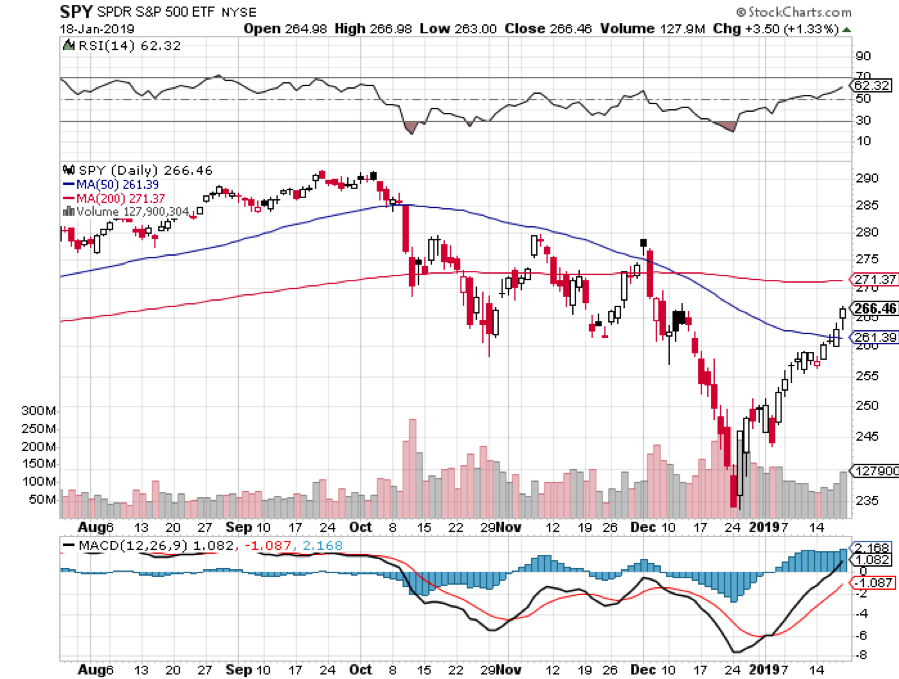
I also kept my short positions in Apple (AAPL) and the S&P 500 (SPY). Happy days are definitely NOT here again, with a government shut down and a continuing trade war with China. I am now nearly neutral, with “RISK ON” positions “RISK OFF” ones.
We have recently seen a surge of new subscribers and for you I urge patience. In this kind of market the money is made on the “BUY”, so timing is everything. The goal is to make as much money you can, not to see how fast or how often you trade.
The upcoming week is very iffy on the data front because of the government shutdown. Some government data may be delayed and other completely missing. Private sources will continue reporting on schedule. All of the data will be completely skewed for at least the next three months. You can count on the shutdown to dominate all media until it is over.
Housing data will be the big events over the coming four days.
On Monday, January 21, markets are closed for Martin Luther King Day.
On Tuesday, January 22, 10:00 AM EST, the December Existing Home Sales are out. IBM (IBM) and Johnson & Johnson (JNJ) announce earnings.
On Wednesday, January 23 at 10:30 AM EST the Energy Information Administration announces oil inventory figures with its Petroleum Status Report. Lam Research (LRCX) and Procter & Gamble (PG) report.
Thursday, January 24 at 8:30 AM EST, we get Weekly Jobless Claims. At 10:00 AM, we learn December Leading Economic Indicators. Intel (INTC) and American Airlines (AA) report.
On Friday, January 25, at 10:00 AM EST, the latest read of December New Home Sales is released. The Baker-Hughes Rig Count follows at 1:00 PM. Schlumberger (SLB) announces earnings. Home Sales is released. AbbVie Inc (ABBV) and DR Horton (DHI) report.
As for me, I will be battling my way home from Lake Tahoe which received seven feet of snow last week. It was a real “snowmageddon.”
Good luck and good trading.
John Thomas
CEO & Publisher
The Diary of a Mad Hedge Fund Trader

Global Market Comments
January 18, 2019
Fiat Lux
Featured Trade:
(WHAT EVER HAPPENED TO THE GREAT DEPRESSION DEBT?),
($TNX), (TLT), (TBT),
(TESTIMONIAL)
Global Market Comments
January 17, 2019
Fiat Lux
Featured Trade:
(WHAT HAPPENED TO THE DOW?)
($INDU), (EK), (S), (BS), (CVX), (DD), (MMM),
(FBHS), (MGDDY), (FL), (GE), (TSLA), (GM)
(WHY YOUR OTHER INVESTMENT NEWSLETTER IS SO DANGEROUS)

"If you can get a dividend higher than the yield on ten-year debt, it's an opportunity we haven't seen in our lifetime. On a five-year horizon, investing in large multinationals with high dividends will have a large payday," said Lawrence Fink, CEO of BlackRock.

Global Market Comments
January 16, 2019
Fiat Lux
Featured Trade:
(HAVE BONDS PEAKED?)
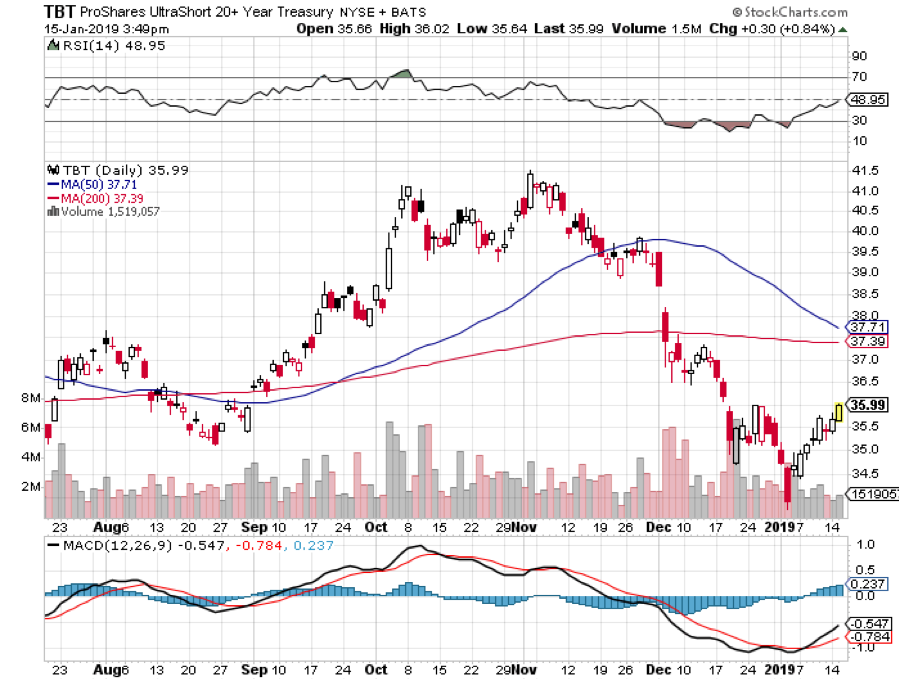
(TLT), (TBT),
(IS USA, INC. A SHORT?)

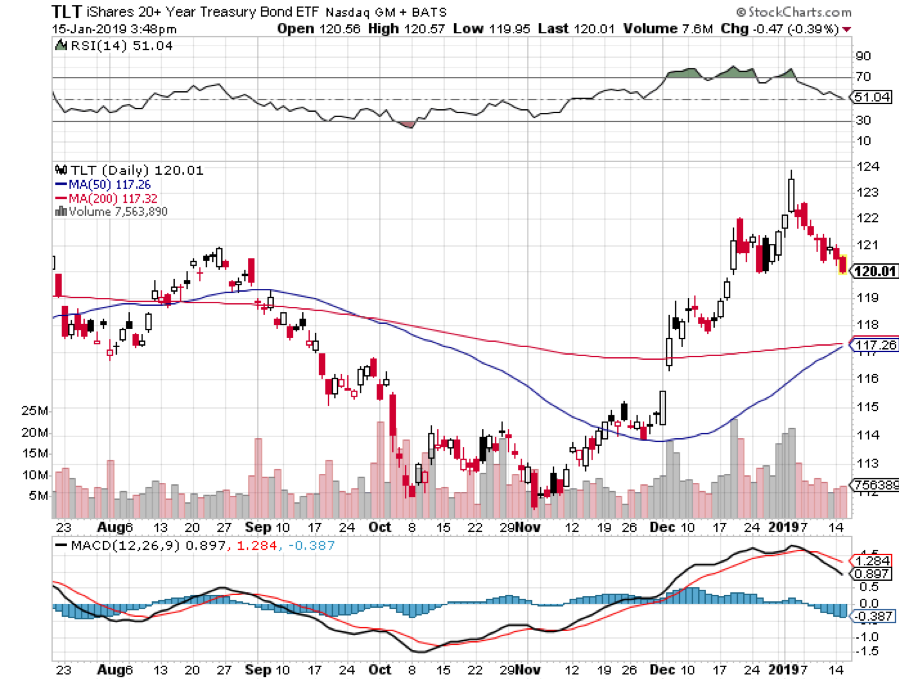
Selling short the US Treasury bond market (TLT) has been one of my core trades for the last 2 ½ years when rates hit a century low at 1.34%.
I call it my “Rich Uncle” trade. Every time bonds rallied five points, I unloaded government debt. If they rallied more, I doubled up. And my new “uncle” reliably wrote me a check every few weeks. As a result, I made money on 22 out of 23 consecutive Trade Alerts on this one asset class.
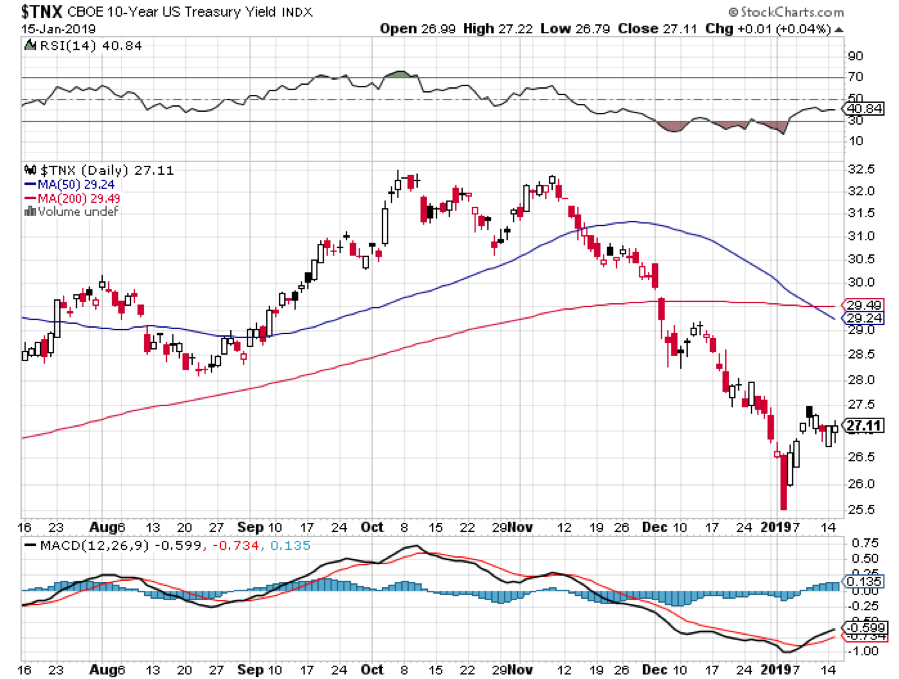
However, the gravy train may be coming to an end. Over the last week, two eminent authorities on bonds, my once Berkeley economics professor and former Federal Reserve governor Janet Yellen, and Golden Sachs (GS), one of the largest bond traders, have both opined that the yield on the ten-year US Treasury bond peaked last October at 3.25%.
My arguments against them are looking increasingly hollow, peaked, and facile. If bonds don’t resume their downtrend soon, I may have to surrender, run up the white flag, and toss my own 4.0% peak forecast in interest rates into the dustbin of history.
The data is undeniably starting to pile up in favor of Yellen and (GS). After a decade of economic expansion, inflation has absolutely failed to show. Sitting here in Silicon Valley which plans to use new technology to destroy 50 million jobs over the next 20 years, it was always obvious to me that wage gains in this recovery would be nil. Wages don’t rise in that circumstance.
So far, so good.
The China trade war continues to extract its pound of flesh from American business, trashing growth prospects everywhere. The government shutdown is also paring US growth by 0.10% a week. Hardly a day goes by now when another research house doesn’t predict a 2020 recession.
Current Fed governor Jay Powell has acknowledged as much, postponing any further interest rate hikes for the first half of this year.
If we peaked at 3.25% then where is the downside? How about zero, or better yet, negative -0.40%, the yield lows seen in Japan and Germany three years ago? That’s when my pal, hedge fund legend Paul Tudor Jones, started betting the ranch on the short side with European bonds making yet another fortune.
That’s when you’ll be able to refi your home with a 30-year conventional fixed rate loan of 2.0%. This is where home loans were available in Europe at the last lows.
After the traumatic move in yields from 3.25% down to 2.64% and (TLT) prices up from $111 to $124, you’d expect the market to give back half of its gains. That’s where we reassess. If the government shutdown is still on at that point, all bets are off.