I am getting a lot of emails about how to come out of the $450-$480 Apple bull call spread, which I advised readers to go into on March 2. Now that we are deep in the money, what is the best way to take a profit?
Well, the first thing for me is to say congratulations. My expectation that Apple stock would continue grinding up has paid off handsomely. The entire position expires next week, on April 20. So the best thing to do here is nothing. You are so far in the money that you are almost certain to expire at the maximum profit point.
So just leave it alone. You don?t have to do anything. The $450 and $480 calls will cancel out each other, and your broker should post a cash credit to your account the following Monday, thus freeing up the margin requirement.
If you try to come out here the execution costs could unnecessarily eat up a chunk of your profit. Since there are two call options involved, that means paying a double trading spread. There is no need for you to pay for a bigger yacht for your broker this early in the year.
The only reason to come out earlier is that you think Apple might fall $150 in the next seven trading days. Given that the Justice Department announced an antitrust action against the company this morning an only knocked the stock down $10, I think this is unlikely.
Your net profit on this position should be $1,855, or? $1.86% for the notional $100,000 portfolio. I include my calculations below. Well done.
Execution
March $450 call cost?????... $97.60
March $480 call premium earned?-$70.25
https://madhedgefundtrader.com/wp-content/uploads/2019/05/cropped-mad-hedge-logo-transparent-192x192_f9578834168ba24df3eb53916a12c882.png00DougDhttps://madhedgefundtrader.com/wp-content/uploads/2019/05/cropped-mad-hedge-logo-transparent-192x192_f9578834168ba24df3eb53916a12c882.pngDougD2012-04-11 23:02:332012-04-11 23:02:33Taking profits on Apple
The prospect of a runaway printing press at the Federal Reserve has been the overwhelming factor driving risk assets in 2012.? Being the sober, cautious guy that you all know me to be, I did not join the party. I tell people this is because if I lose all my money I am too old to start over again as an entry level trader at Morgan Stanley.
There is the additional complication that they probably wouldn?t touch me with a ten foot poll anyway. I never was much of an organization man, and in any case the firm has changed beyond all recognition from the small, white shoed, private partnership I knew during the early 1980?s.
Not that I am a party pooper. In fact, I believe that the prospect of further quantitative easing is a complete. The LTRO, Europe?s own quantitative easing, also known as QE3 through the backdoor, with a foreign accent and without a green card, never made over to the US. It poured into European sovereign debt instead, then yielding 8% to 15% for investment grade paper. On my advice, the Chinese government lapped it up.
You can see this clear as day by looking at the chart below prepared by the Federal Reserve of St. Louis, which tabulates a broad, adjusted monetary base. It has been flat as a pancake since QE2 ended on June 30, 2011. That is the day the $75 billion a month in government bond buying abruptly ended. It also was the day that the meteoric assent by the broader money supply came to a screeching halt.
The implications of this for the stock market are not good. It means that the entire rally in global equities from the October lows has been faith based. As I never tire of telling my guests at my strategy luncheons, faith based actions are religions, not investment strategies, and the church down the street can do a far better job at this than I can. Take away that faith, turn traders back into the mercenary agnostics that they really are, and all of a sudden stocks look very expensive.
Listeners to my biweekly strategy webinars already know that we have a 4% GDP stock market and a 2% GDP economy. We also have PE multiple for stocks expanding just when analysis are chopping forecasts as fast as they can. Outside of Apple and Google, who is really going to announce a blowout Q1, 2012, with China and Europe in a race to see who can get into recession the fastest, the source of 50% of S&P 500 earnings?
Now that I have had my say, I?m taking the rest of the afternoon off. There is a major storm approaching the US west coast and with luck, I can surf some 50 foot waves at the nearby Mavericks, dodging jagged rocks along the way. Like I said, I was always a sober, cautious guy.
As we continue flirting with a final top in equities for the year, I am stepping up my search for the best ways to participate on the downside. At the very top of the list are the homebuilders, one of the top performing sectors since the October, 2011 bottom. The performance of individual names has been absolutely blistering, with Pulte Homes (PHM) clocking a 245% move to the upside, beating the (SPX) by 210%.
You do not need to engage in any sophisticated financial analysis to see how expensive this group is. Spend a day visiting open houses put on by the big companies, like Pulte Homes (PHM), KB Homes (KBH), Ryland Group (RYL), Toll Brothers (TOL), and Lennar (LEN), as I did yesterday. Then scan the real estate pages of your hometown newspaper with a calculator in hand. You will quickly find that new homes are selling for double the cost of existing homes on a dollar per square foot basis.
This is a lot to pay for that black granite kitchen counter, built in vacuum system, flashy gas barbeque in the back yard, and solar panels on the roof. You may also notice that the homes are shoehorned so tightly on to their plots that you will become too familiar with the intimate details of the lives of your prospective neighbors. In fact, new homes are trading at the biggest premium over used in history.
I am loathe to bet against those lucky ones selling to the 1%, or anyone who earns close to them, whose wealth and spending power are expanding exponentially as I write this. That knocks out Lennar (LEN) and Toll Brothers (TOL). I am very happy to short stocks of companies saddled with selling on an increasingly impoverished 99%.
That trains my sites over to Pulte Homes (PHM) and KB Homes (KBH), the old Kaufman & Broad. (KBH) has already fallen 38% off of a poor earnings report. At least Eli Broad had the decency to give away most of his money after selling out at the market top. The Los Angeles art world is all the richer for it. That leaves Pulte (PHM) as the next overripe piece of fruit to fall.
I know that many of you have been getting calls from real estate brokers insisting that the bottom is in and prices are on their way up. I get the same calls from stock brokers too. Here are the reasons for you to let those calls go straight to voicemail.
There is still a huge demographic headwind, as 80 million baby boomers
try to sell houses to 65 million Gen Xer?s, who earn half as much money. Don?t plan on selling your home to your kids, especially if they are still living rent free in the basement. There are six million homes currently late on their payments, in default, or in foreclosure, and an additional shadow inventory of 15 million units. Access to credit is still severely impaired to everyone, except, you guessed it, the 1%.
Fannie Mae and Freddie Mac, which supply 95% of all the home mortgages in the US, are still in receivership, and are in desperate need of $100 billion in new capital each. Good luck getting that out of Washington, which is likely to be gridlocked for at least another five years, and maybe more.
The home mortgage deduction is a big target in any revamp of the tax system, which would immediately yield $250 billion in new revenues for the government. How do you think that will impact home process?
There are undeniable signs of life in best prime markets, where the pent up demand can be substantial. Here in the San Francisco Bay area you are seeing bidding wars for anything that is commuting distance from Apple, Google, and Facebook, or the rest of the booming tech world. Real estate is more local now than it ever has been.
The best case scenario for home prices is that we continue bumping along a bottom for as long as ten more years, when the demographic picture shifts from a huge headwind to a major tailwind. The worst case is that this is just another bear market rally and that we have another 20% on the downside.
https://www.madhedgefundtrader.com/wp-content/uploads/2012/04/house-2.jpg281400DougDhttps://madhedgefundtrader.com/wp-content/uploads/2019/05/cropped-mad-hedge-logo-transparent-192x192_f9578834168ba24df3eb53916a12c882.pngDougD2012-04-09 23:03:272012-04-09 23:03:27Looking for Shorting Opportunities Among the Homebuilders
I am sitting here on Easter weekend sifting through pages and pages from the various technical programs I follow warning that the roof is about to cave in on the stock market. Friday?s nonfarm payroll bombshell was dropped right at a key, make or break level for the S&P 500 and the Dow Average. Hold here, and we grind to a marginal new high in weeks. Fail, and it is all over this year but for the crying.
The action in the futures market immediately after the release of the dismal numbers showed that the outcome of this contest has already been decided. S&P 500 futures gapped down from plus 4 points to down 15 points in minutes. The Dow saw a net swing of a gut churning 170 points. Ten year Treasury yields gapped down from 2.22% to 2.08%. The safe haven dollar soared against the euro. It was all, yet again, another harsh lesson on why you don?t take big positions before monthly nonfarm payroll figures, and why you should never listen to the ?experts?.
I couldn?t be more amused watching analysts? reactions to the figures on TV, who had been forecast as high as 250,000 and noticeably blanched when the flash hit the screen. In fact, this is one of the biggest head fakes that I have seen in sometime. The Thursday weekly jobless claims hit a four year low only the day before, pointing followers to the exact opposite direction. So did Canadian job gains, which hit a 30 year high for the month. Extrapolate that to the US and we should have seen of blistering gain of 750,000, not the feeble 120,000 we got.
A closer examination of the numbers offered little solace. The headline unemployment rate fell from 8.3% to 8.2%, but only because there are fewer job seekers. Manufacturing showed the biggest gain, +37,000, followed by food and drinking services, +37,000, professional and business services +31,000, and health care, +26,000. The big hit was taken by retail, -34,000. There are 12.7 million total unemployed, and the broader U-6 unemployment rate dropped from 14.9% to 14.5%.
It looks like the good winter weather bump we saw in February disappeared after possibly pulling as many as 50,000 jobs forward from the spring, generating the great payroll number for the previous month. That explains why the February correction in the market I had been expected never showed.
These unwelcome developments call into question the survival of the entire 35% bull move. It will be very interesting to see how many traders flip to sell every rally mode this week after spending the last six months buying every dip. Watch Apple. It will be key. So will the raft of data releases about the Chinese economy, which will be tricking out every night this week.
I was hoping for a healthy payroll number on Friday to give us a nice two day rally which I could use to reestablish my short positions. At least I covered my yen short, which is also bouncing hard. Now I have to decide if I want to sell into the dip. Welcome to show business.
Last week saw a dramatic deterioration in the economic data that has been the foundation of the Great Bull Market of 2012.
First, we read minutes from a Federal Reserve meeting suggesting that QE3 has been put on a back burner. Then the Department of Labor?s Friday nonfarm payroll report poured gasoline on the fire, coming in at 120,000, versus an expected 210,000. Until this week, the best you could say about the data flow was that it was mixed. Now it is decidedly negative.
Whenever we see sea change events like this bunch up over a short time period, I like to show readers my cross asset class review, which I conduct on a daily basis. This discipline is great at showing which securities are trading in line with the rest of the world, and which ones aren?t. And guess what is looking outrageously expensive right now?
The charts show that trouble has in fact brewing for a few months. Asset classes have been rolling over like a line of dominoes. This is the way bull markets always end, and this time should be no different.
The Australian dollar (FXA) saw the weakness coming first, which peaked on April 6.
The Australian stock market (EWA) followed, peaking on February 28.
Copper (CU) warned that trouble was coming, peaking on February 12.
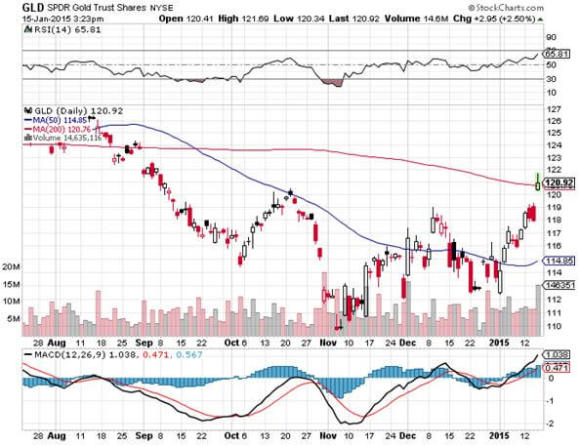
Then Gold (GLD) faded on April 12.
And Silver (SLV) on February 28.
Bonds never bought the ?RISK ON? on scenario. The ten year Treasury ETF (IEF) is down less than three points from its 2011 peak, instead of the 15 points we should have gotten if the economy had truly entered a sustainable stage in the recovery.
Only equities (SPX) didn?t see ?RISK OFF? coming
Because it was all about Apple (AAPL), which added $225 billion in new market capitalization this year. That amounts to creating the third largest company from scratch, right after Exxon (XOM).
The final message of all of these charts is that equities alone have been powering up for months while every other asset class in the world has been dying a slow death. Experience shows that this only ends in tears for equity holders. I?ll let you adjust your own positions accordingly.
With the Federal Reserve signaling yesterday that QE3 is off the table, many traders are now betting that the barbarous relic is about to take a prolonged vacation.
Without a dividend or an interest yield in a world desperate for cash flow, the yellow metal suddenly doesn?t have so much to offer. Take away the fear of inflation that our deflationary reality assures, and gold is suddenly left wanting, along with all other hard assets. Uncle Buck becomes the big man on campus.
For the first time in many years, gold is ranking high on the list of preferred hedge fund shorts. The US Treasury?s sale of America eagle one ounce gold coins is down 70% from last year and is now plumbing a four year low. Open interest in the gold futures market has hit a 2 ? year low, indicating that capital is fleeing the market. This is usually what happens before prices die.
Physical markets in Asia, long a bulwark in the gold bull case, are suffering from declining volumes. India, long the world?s largest buyer of physical gold, just doubled import taxes, causing widespread strikes among jewelers.
Industry experts have been warning me for some time that the scrapage rate was soaring, thanks to retail gold buying shops popping up on almost every other street corner, and it was just a matter of time before this would have a major dampening effect on prices.? Remember those stories about gold coin vending machines popping up around the world? You don?t hear those anymore.
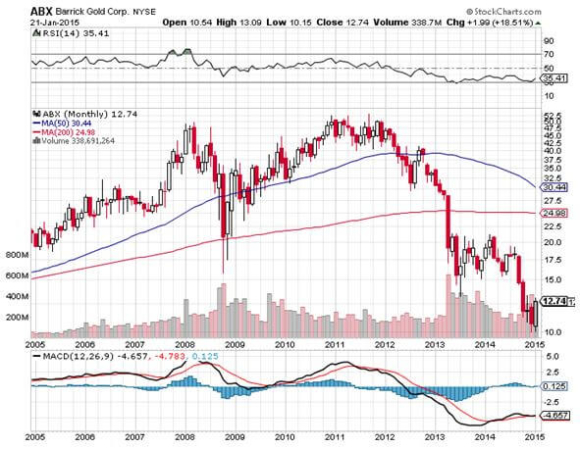
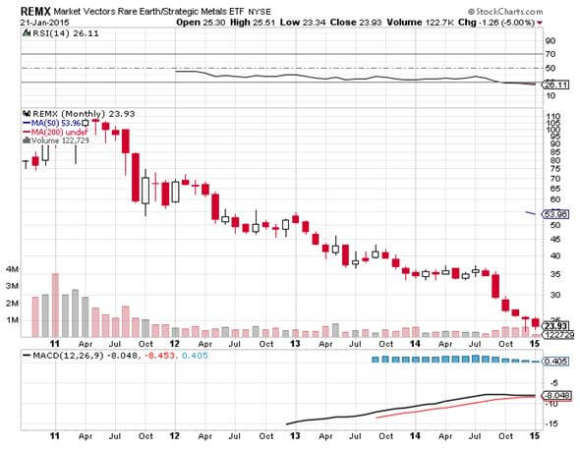
Indeed, the gold miners have been signaling for some time that the gold bugs were about to suffer a healthy dose of insecticide. Look no further than the chart for Barrack Gold (ABX), the world largest producer of the yellow metal, and a woeful underperformer compared to its benchmark product. Other miners have fared far worse.
Take speculation about future gold price appreciation away, and all of a sudden miners don?t have such a great business model. The problem is that they are not making gold anymore. Companies are having to dig deeper in more dangerous and inaccessible parts of the world, and pay bigger bribes to get there. (ABX) isn?t opening a new mines at 15,000 feet in the Andes because their like the fresh air and the scenery. Freezing water, and essential ingredient in the mining process, has become a major problem.
There is the added dilemma that the inventory sitting in the back of the shop is now falling in value instead of increasing. Barrack has made a big deal about abandoning its gold hedging strategy. That worked great for the past three years, but may not do as well going forward.
Cost inflation suffered by mining companies is the highest in the industrial world, and is now running at about a 20% annual rate, be it for labor, heavy equipment, infrastructure development, royalty fees, and so on. The tires for those giant trucks used in mining now cost $100,000 each and have a three year waiting list. The secondary market for them is booming.
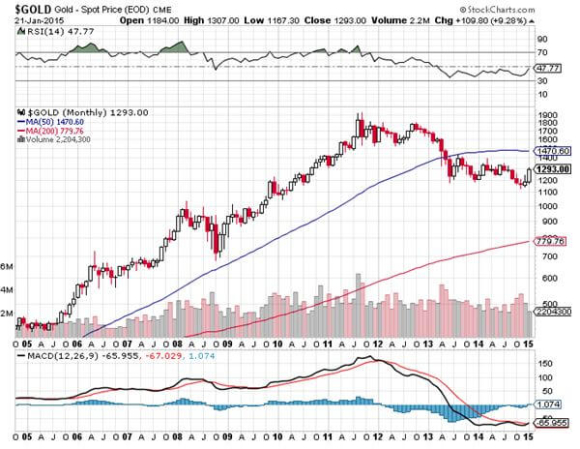
It doesn?t take a rocket scientist to figure out that the technical picture for gold has been rapidly deteriorating. Gold has suffered an 8% sell off since the end of February, and is now up only 6% in 2012, underperforming most other asset classes. Look at the chart below, and the most charitable thing you can say is that with are approaching the bottom end of a $1,500-$1,925 range. But look at the longer term charts and it is clear that we have just witnessed a head and shoulders formation that has dramatically failed.
The chip shot on the downside for gold here is $1,500. More aggressive traders may want to reach for $1,450. Bring a double dip scare for the economy into the picture, which I expect to see this summer, and $1,100 is a possibility. If you get a real stock market crash in 2013, as many analysts are predicting, and you?ll get another chance to buy at $750.
Use the periodic short term bursts of buying, that are increasingly being seen by the trading community as a contrarian trade, as a great chance to leg into short dated puts on the SPDR Gold Trust Shares ETF (GLD).
Long term, I still like gold and expect it to hit the old inflation adjusted high of $2,300 during the next hard asset buying binge. But remember also that long term, we are all dead.
That is the conundrum facing traders, investors, and individuals as we enter the new quarter. For some hedge fund managers, Q1, 2012 was clearly the quarter from hell.
I have been in the market for four decades, long enough to collect an encyclopedia worth of words of wisdom. One of my favorites has always been ?Sell in May and Go? away. On close inspection you?ll find there is more than a modicum of truth is this time worn expression.
Refer to your handy Stock Traders Almanac and you?ll find that for the last 50 years the index yielded a paltry 1% return from May to October. From November to April it brought in a far healthier 7% return.
This explains why you find me with my shoulder to the grindstone from during the winter, and jetting about from Baden Baden to Monte Carlo and Zermatt in the summers. Take away the holidays and this is really a four month a year job.
My friends at StockCharts.com put together the data from the last ten years, and the conclusions on the chart below are pretty undeniable. They have marked every May with a red arrow and Novembers with green arrows.
What is unusual this year is that we are going into the traditional May peak on top of a prodigious 12 % gain in the S&P 500, one of the sturdiest moves in history. History also shows that the bigger the move going into the April peak, the more savage the correction that follows. What do they say in golf? Fore?
Being a long time student of the American, and indeed, the world economy, I have long had a theory behind the regularity of this cycle. It?s enough to base a pagan religion around, like the once practicing Druids at Stonehenge.
Up until the 1920?s, we had an overwhelmingly agricultural economy. Farmers were always at maximum financial distress in the fall, when their outlays for seed, fertilizer, and labor were at a maximum, but they had yet to earn any income from the sale of their crops. So they had to all borrow at once, placing a large call on the financial system as a whole. This is why we have seen so many stock market crashes in October. Once the system swallows this lump, its nothing but green lights for six months.
Once the cycle was set and easily identifiable by low end computer algorithms, the trend became a self fulfilling prophesy. Yes, it may be disturbing to learn that we ardent stock market practitioners may in fact be the high priests of a strange set of beliefs. But hey, some people will do anything to outperform the market.
https://www.madhedgefundtrader.com/wp-content/uploads/2012/04/bull-2.jpg300400DougDhttps://madhedgefundtrader.com/wp-content/uploads/2019/05/cropped-mad-hedge-logo-transparent-192x192_f9578834168ba24df3eb53916a12c882.pngDougD2012-04-02 23:03:182012-04-02 23:03:18If You Sell in May and Go Away, What to do in April?
You know how I love second helpings, especially when the sushi bar is involved. I especially like unagi, or cooked eel, which is said to be an oriental aphrodisiac.
I am going to take advantage of Japan?s fiscal year end book closing on March 30 to reenter my short position of the Japanese yen. This is the one time a year when Japanese corporations suddenly repatriate yen back to Japan to beef up the cash on their books for their annual reports. Every year, this creates a quick boost to the yen against the US dollar which fades away in the following weeks like so much smoke.
Like everything else this year, the yen has had a straight line move since I put out my last call to sell the yen at the end of January. So while I made a nice profit on the first trade, I was never given another chance to reenter on the way down. Now I have that opportunity.
Since the yen bottomed on March 21, it has given back 25% of the move. Sure, I would prefer to get back in on the traditional one third pull back. But there are so few attractive trading opportunities out there right now that I am happy to jump the gun. If the yen strengthens more from here I will simply double up the position. This is a trade that I?ll be happy to live with for a while.
I have hammered away at the structural weakness of the Japanese economy ad nauseum for the past year. The one liner is that buyers of the country?s 1% yielding ten year bonds are dying off in droves, it has the world?s worst debt to GDP ratio, and labors under an Armageddon like demographic burden. It doesn?t help that they haven?t invested anything new since Godzilla ate the big screen. Sony (SNE) should have become Apple (AAPL). For those who wish to undertake a refresher course, please read the research pieces listed below:
* ?Momentum is Building for the Yen Shorts? on March 26 at http://madhedgefundradio.com/momentum-is-building-for-the-yen-shorts/
*? ?Nikkei Shows the Yen Move is Real? on February 20 at http://madhedgefundradio.com/nikkei-shows-the-yen-move-is-real/
*? ?Global Trading Dispatch Hits 64%, 11 Day Home Run on Yen Short? on February 13 at
http://madhedgefundradio.com/global-trading-dispatch-hits-64-11-day-home-run-on-yen-short/
*? ?Rumblings in Tokyo? on February 5 at http://madhedgefundradio.com/rumblings-in-tokyo/
*? ?Is This the Chink in Japan?s Armor?? on January 29 at http://madhedgefundradio.com/is-this-the-chink-in-japans-armor/
My preferred instrument here is the Currency Shares Japanese Yen Trust ETF (FXY) , where I will be buying the June, 2012 puts. At the very least, the (FXY) should make it back down to $117 in the near future, a price we visited just a week ago, which should give you a quickie 70%? return on the June $120 puts.
For those who are unwilling or unable to play in the options space, you can invest in the ProShares Ultra Yen Short ETF (YCS), a 2X leveraged bet that the yen falls against the dollar.
https://madhedgefundtrader.com/wp-content/uploads/2019/05/cropped-mad-hedge-logo-transparent-192x192_f9578834168ba24df3eb53916a12c882.png00DougDhttps://madhedgefundtrader.com/wp-content/uploads/2019/05/cropped-mad-hedge-logo-transparent-192x192_f9578834168ba24df3eb53916a12c882.pngDougD2012-04-01 23:04:022012-04-01 23:04:02Double Dipping on the Yen
This time I am going to start with the fundamental argument first, then follow up with the Trade Alert.
We are getting perilously close to a substantial pull back in global risk assets. While this has already started in commodities, the ags, oil, copper, and precious metals, we have yet to see the whites of their eyes in equities. I believe at these levels stocks are the planet?s most overvalued assets, at least on a short term trading basis. So I have begun more aggressively searching for plays that would benefit from substantial moves southward.
My personal preference is to gain downside exposure on small capitalization stocks. You can achieve this through buying put options on the Russell 2000 iShares ETF (IWM).
You have several things going for you in falling markets with this ETF. Small stocks are illiquid and therefore suffer the biggest pullback during market corrections. If Heaven forbid, double dip fears return this summer, small caps will fall the farthest and the fastest. They are most dependent on outside financing which rapidly dries up during times of economic distress.
You can see this clearly during last year?s summer swoon. The last time we thought the world was going to end, the (SPX) fell by 20% while the (IWM) plunged by 29.5%. This means that small cap stocks are likely to deliver 150% of the downside compared to big cap stocks. Making money then with shorts in the (IWM) was like shooting fish in a barrel.
You see this on the upside as well. Since the October, 2011 lows, the (SPX) leapt by 30% compared to a much more virile 38% move by (IWM). The (IWM) really does present the scenario where the smaller (or higher) they are, the harder they fall.
If you go into the options market you get this extra volatility at a discount. June at-the-money puts for the (SPY) carry an implied volatility of 15%, compared to 20% for the (IWM) puts. That means you get 50% more anticipated movement in the index for a premium of only 33%.
For those who wish to avoid options, you can buy the inverse ETF on the sector, the (RWM). But the liquidity for this instrument is a mere shadow of its upside cousin, the (IWM). You are better off shorting the (IWM) than buying the (RWM).
https://www.madhedgefundtrader.com/wp-content/uploads/2012/04/497909.jpg961735DougDhttps://madhedgefundtrader.com/wp-content/uploads/2019/05/cropped-mad-hedge-logo-transparent-192x192_f9578834168ba24df3eb53916a12c882.pngDougD2012-04-01 23:03:222012-04-01 23:03:22Where to Play From the Short Side
ETF's are much more attractive than mutual fund competitors, with their notoriously bloated expenses and spendthrift marketing costs. You can't miss those glitzy, overproduced, big budget ads on TV for a multitude of mutual fund families. You know, the ones with the senior couple holding hands walking down the beach into the sunset, the raging bulls, etc? You are the sucker who is paying for these. Sometimes I confuse them for Viagra commercials.
I once did a comprehensive audit on a mutual fund, and a blacker hole you never saw. There were so many conflicts of interest it would have done Bernie Madoff proud. Any trainee assistant trader can tell you that more than 90% of all mutual fund managers reliably underperform the indexes, some grotesquely so. Published performance is bogus, they show a huge survivor bias, not including the hundreds of mutual funds that close each year. And there's always that surprise tax bill at the end of the year.
If there was ever an industry crying out for a fundamental restructuring, consolidation, price competition, and ultimately a whopping great downsizing, it is the US mutual fund industry. ETF's may be the accelerant that ignited this epochal sea change, with the number of mutual funds recently having shrunk from 10,000 to 8,000. It's still early days, with ETF's only accounting for 5-6% of trading volume, even though they have been around for a decade.
https://www.madhedgefundtrader.com/wp-content/uploads/2012/03/turkey.jpg256320DougDhttps://madhedgefundtrader.com/wp-content/uploads/2019/05/cropped-mad-hedge-logo-transparent-192x192_f9578834168ba24df3eb53916a12c882.pngDougD2012-03-29 23:04:382012-03-29 23:04:38The Death of the Mutual Fund
Legal Disclaimer
There is a very high degree of risk involved in trading. Past results are not indicative of future returns. MadHedgeFundTrader.com and all individuals affiliated with this site assume no responsibilities for your trading and investment results. The indicators, strategies, columns, articles and all other features are for educational purposes only and should not be construed as investment advice. Information for futures trading observations are obtained from sources believed to be reliable, but we do not warrant its completeness or accuracy, or warrant any results from the use of the information. Your use of the trading observations is entirely at your own risk and it is your sole responsibility to evaluate the accuracy, completeness and usefulness of the information. You must assess the risk of any trade with your broker and make your own independent decisions regarding any securities mentioned herein. Affiliates of MadHedgeFundTrader.com may have a position or effect transactions in the securities described herein (or options thereon) and/or otherwise employ trading strategies that may be consistent or inconsistent with the provided strategies.
We may request cookies to be set on your device. We use cookies to let us know when you visit our websites, how you interact with us, to enrich your user experience, and to customize your relationship with our website.
Click on the different category headings to find out more. You can also change some of your preferences. Note that blocking some types of cookies may impact your experience on our websites and the services we are able to offer.
Essential Website Cookies
These cookies are strictly necessary to provide you with services available through our website and to use some of its features.
Because these cookies are strictly necessary to deliver the website, refuseing them will have impact how our site functions. You always can block or delete cookies by changing your browser settings and force blocking all cookies on this website. But this will always prompt you to accept/refuse cookies when revisiting our site.
We fully respect if you want to refuse cookies but to avoid asking you again and again kindly allow us to store a cookie for that. You are free to opt out any time or opt in for other cookies to get a better experience. If you refuse cookies we will remove all set cookies in our domain.
We provide you with a list of stored cookies on your computer in our domain so you can check what we stored. Due to security reasons we are not able to show or modify cookies from other domains. You can check these in your browser security settings.
Google Analytics Cookies
These cookies collect information that is used either in aggregate form to help us understand how our website is being used or how effective our marketing campaigns are, or to help us customize our website and application for you in order to enhance your experience.
If you do not want that we track your visist to our site you can disable tracking in your browser here:
Other external services
We also use different external services like Google Webfonts, Google Maps, and external Video providers. Since these providers may collect personal data like your IP address we allow you to block them here. Please be aware that this might heavily reduce the functionality and appearance of our site. Changes will take effect once you reload the page.