Risk Control for Dummies
There is a method to my madness, although I understand that some new subscribers may need some convincing.
Whenever I change my positions, the market makes a major move or reaches a key crossroads, I look to stress test my portfolio by inflicting various extreme scenarios upon it and analyzing the outcome.
This is second nature for most hedge fund managers. In fact, the larger ones will use top of the line mainframes powered by $100 million worth of in-house custom programming to produce a real-time snapshot of their thousands of positions in all imaginable scenarios at all times.
If you want to invest with these guys feel free to do so. They require a $10-$25 million initial slug of capital, a one year lock up, charge a fixed management fee of 2% and a performance bonus of 20% or more.
You have to show minimum liquid assets of $2 million and sign 50 pages of disclosure documents. If you have ever sued a previous manager, forget it. The door slams shut. And, oh yes, the best performing funds are closed and have a ten-year waiting list to get in. Unless you are a major pension fund, they don’t want to hear from you.
Individual investors are not so sophisticated, and it clearly shows in their performance, which usually mirrors the indexes less a large haircut. So, I am going to let you in on my own, vastly simplified, dumbed down, seat of the pants, down and dirty style of risk management, scenario analysis, and stress testing that replicates 95% of the results of my vastly more expensive competitors.
There is no management fee, performance bonus, disclosure document, lock up, or upfront cash requirement. There’s just my token $3,000 a year subscription fee and that’s it. And I’m not choosy. I’ll take anyone whose credit card doesn’t get declined.
To make this even easier, you can perform your own analysis in the excel spreadsheet I post every day in the paid-up members section of Global Trading Dispatch. You can just download it and play around with it whenever you want, constructing your own best case and worst-case scenarios. To make this easy, I have posted this spreadsheet on my website for you to download by clicking here.
Since this is a “for dummies” explanation, I’ll keep this as simple as possible. No offense, we all started out as dummies, even me.
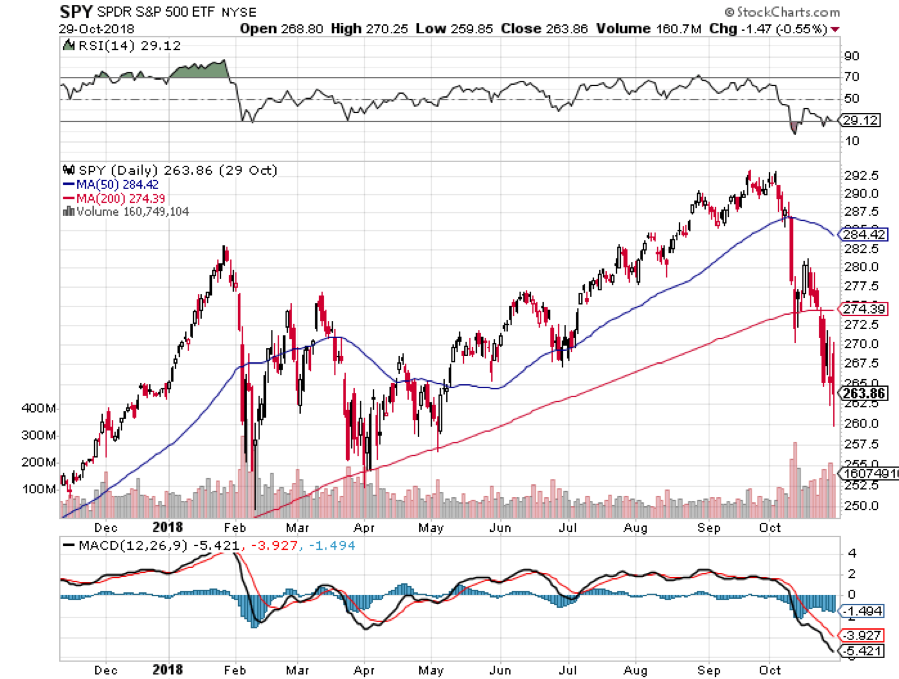
I’ll take Mad Hedge Model Trading Portfolio at the close of October 29, the date that the stock market bottomed and when I ramped up to a very aggressive 75% long with no hedges. This was the day when the Dow Average saw a 1,000 point intraday range, margin clerks were running rampant, and brokers were jumping out of windows.
I projected my portfolio returns in three possible scenarios: (1) The market collapses an additional 5% by the November 16 option expiration, some 15 trading days away, falling from $260 to $247, (2) the S&P 500 (SPY) rises 5% from $260 to $273 by November 16, and (3) the S&P 500 trades in a narrow range and remains around the then current level of $260.
Scenario 1 – The S&P 500 Falls 5%
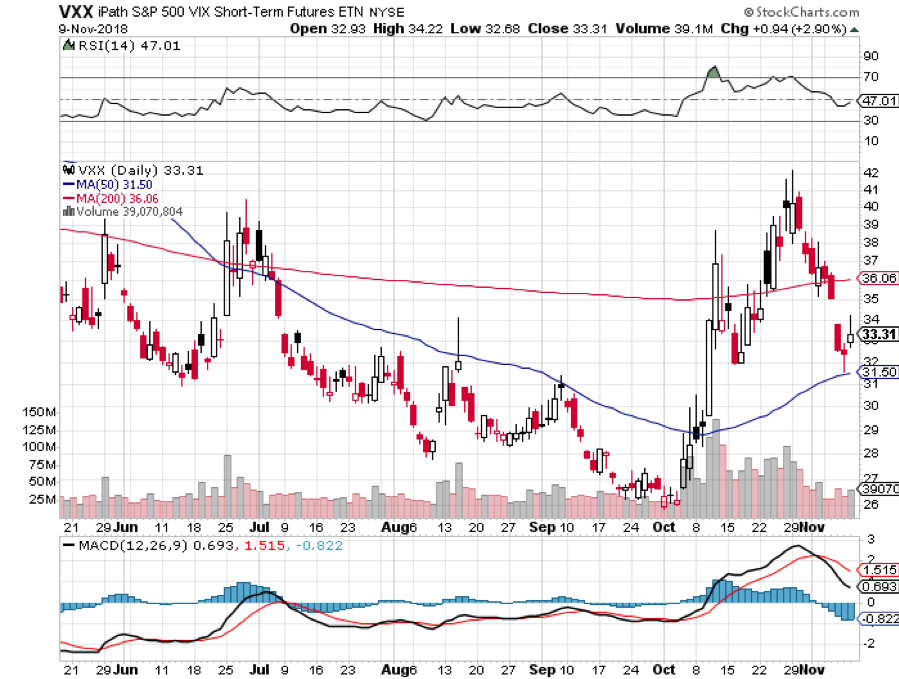
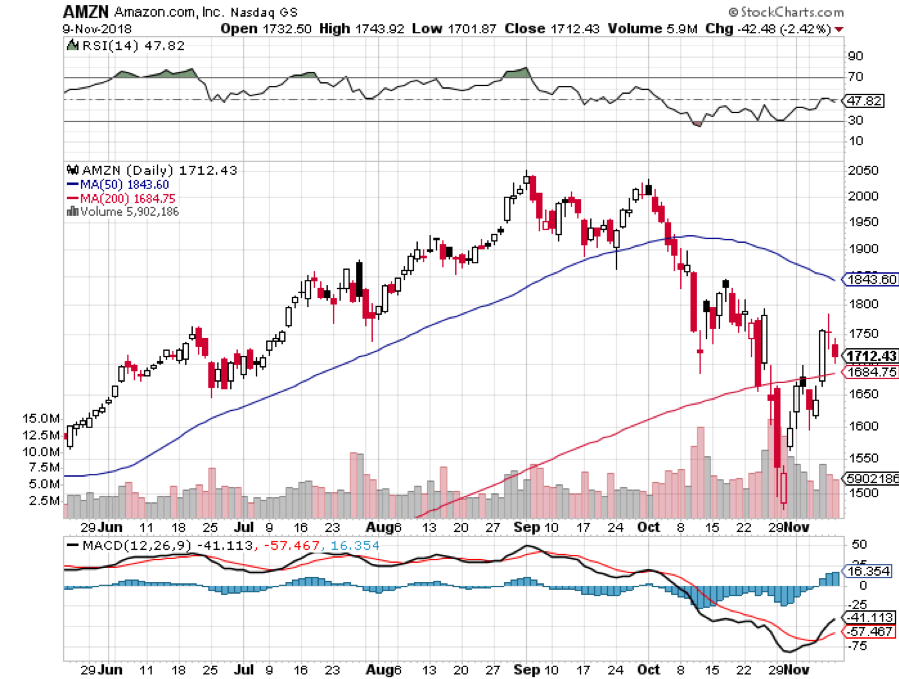
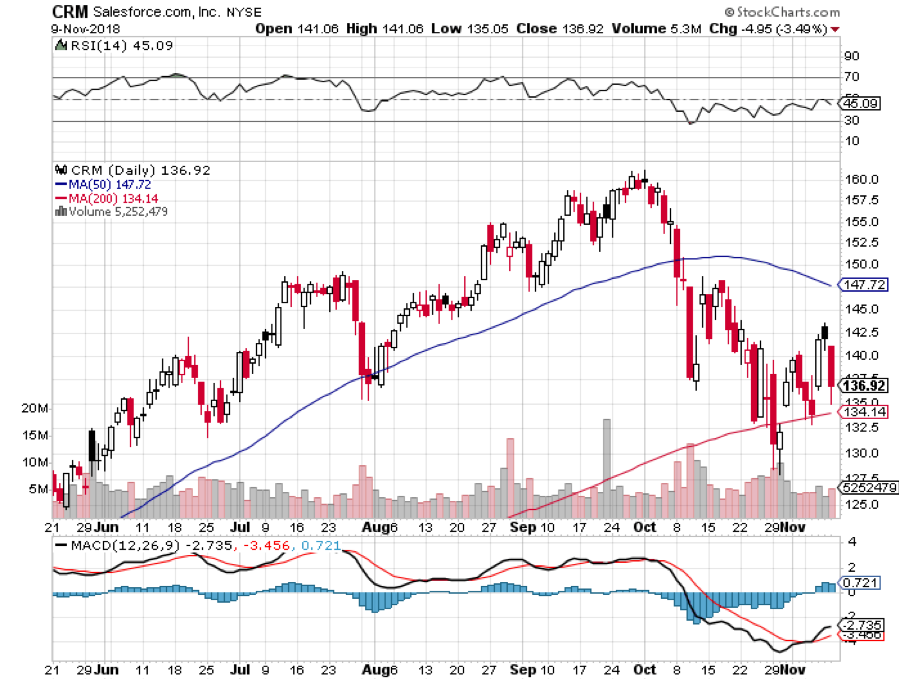
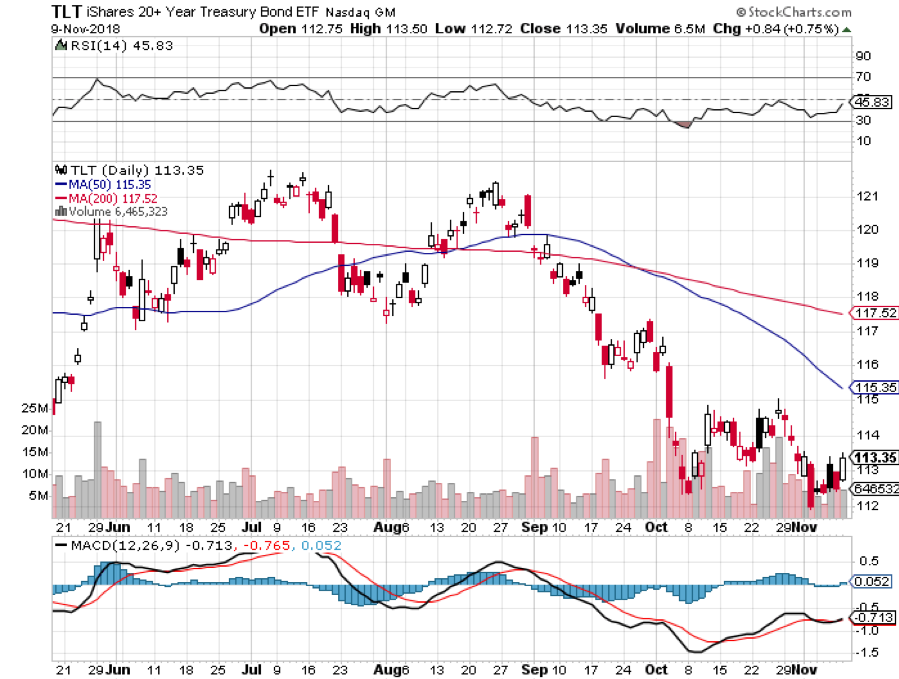
A 5% loss and an average of a 5% decline in all stocks would take the (SPY) down to $247, well below the February $250 low, and off an astonishing 15.70% in one month. Such a cataclysmic move would have taken our year to date down to +11.03%. The (SPY) $150-$160 and (AMZN) $1,550-$1,600 call spreads would be total losses but are partly offset by maximum gains on all remaining positions, including the S&P 500 (SPY), Salesforce (CRM), and the United States US Treasury Bond Fund (TLT). My Puts on the iPath S&P 500 VIX Short Term Futures ETN (VXX) would become worthless.
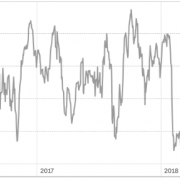
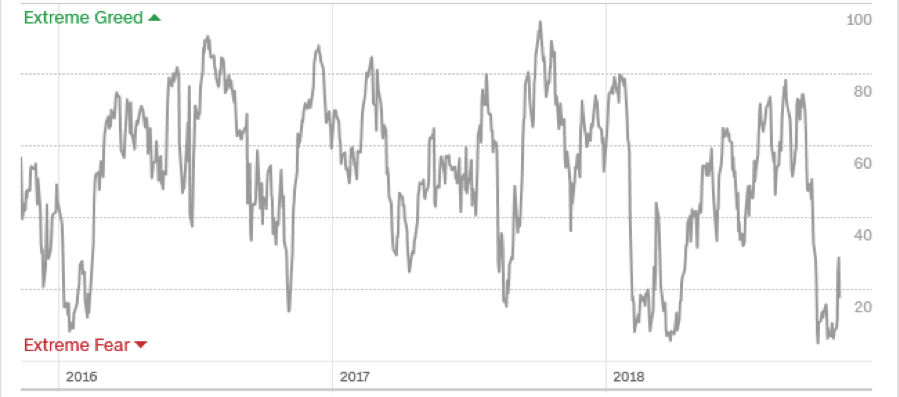
However, with real interest rates at zero (3.1% ten-year US Treasury yield minis 3.1% inflation rate), the geopolitical front quiet, and my Mad Hedge Market Timing Index at a 30 year low of only 4, I thought there was less than a 1% chance of this happening.
Scenario 2 – S&P 500 rises 5%
The impact of a 5% rise in the market is easy to calculate. All positions expire at their maximum profit point, taking our model trading portfolio up 37.03% for 2018. It would be a monster home run. I would make back a little bit on the (VXX) but not much because of time decay.
Scenario 3 – S&P 500 Remains Unchanged
Again, we do OK, given the circumstances. The year-to-date stands at a still respectable 22.03%. Only the (AMZN) $1,550-$1,600 call spread is a total loss. The (VXX) puts would become nearly a total loss.
As it turned out, Scenario 2 played out and was the way to go. I stopped out of the losing (AMZN) $1,550-$1,600 call spread two days later for only a 1.73% loss, instead of -12.23% in the worst-case scenario. It was a case of $12.23 worth of risk control that only cost me $1.73. I’ll do that all day long, even though it cost me money. When running hedge funds, you are judged on how you manage your losses, not your gains, which are easy.
I took profit on the rest of my positions when they reached 88%-95% of their maximum potential profits and thus cut my risk to zero during these uncertain times. October finished with a gain of +1.24. By the time I liquidated my last position and went 95% cash, I was up 32.95% so far in 2018, against a Dow average that is up 2% on the year. It was a performance for the ages.
Keep in mind that these are only estimates, not guarantees, nor are they set in stone. Future levels of securities, like index ETFs, are easy to estimate. For other positions, it is more of an educated guess. This analysis is only as good as its assumptions. As we used to say in the computer world, garbage in equals garbage out.
Professionals who may want to take this out a few iterations can make further assumptions about market volatility, options implied volatility or the future course of interest rates. And let’s face it, politics was a major influence this year.
Keep the number of positions small to keep your workload under control. Imagine being Goldman Sachs and doing this for several thousand positions a day across all asset classes.
Once you get the hang of this, you can start projecting the effect on your portfolio of all kinds of outlying events. What if a major world leader is assassinated? Piece of cake. How about another 9/11? No problem. Oil at $150 a barrel? That’s a gimme.
What if there is an Israeli attack on Iranian nuclear facilities? That might take you all of two minutes to figure out. The Federal Reserve launches a surprise QE5 out of the blue? I think you already know the answer.
Now that you know how to make money in the options market, thanks to my Trade Alert service, I am going to teach you how to hang on to it.
There is no point in being clever and executing profitable trades only to lose your profits through some simple, careless mistakes.
So I have posted a training video on Risk Management. Note: you have to be logged in to the www.madhedgefundtrader.com website to view it.
The first goal of risk control is to preserve whatever capital you have. I tell people that I am too old to lose all my money and start over again as a junior trader at Morgan Stanley. Therefore, I am pretty careful when it comes to risk control.
The other goal of risk control is the art of managing your portfolio to make sure it is profitable no matter what happens in the marketplace. Ideally, you want to be a winner whether the market moves up, down, or sideways. I do this on a regular basis.
Remember, we are not trying to beat an index here. Our goal is to make absolute returns, or real dollars, at all times, no matter what the market does. You can’t eat relative performance, nor can you use it to pay your bills.
So the second goal of every portfolio manager is to make it bomb proof. You never know when a flock of black swans is going to come out of nowhere, or another geopolitical shock occurs, causing the market crash.
I’ll also show you how to use my Trade Alert service to squeeze every dollar out of your trading.
So, let’s get on with it!
To watch the Introduction to Risk Management, please click here.
Mad Hedge Market Timing Index

