Risk Control for Dummies
Whenever I change my positions, the market makes a major move, suffers a “black swan” or reaches a key level, I stress test my portfolio by inflicting various scenarios upon it and analyzing the outcome.
This is common practice and second nature for most hedge fund managers.
In fact, the larger ones will use top-of-the-line mainframes powered by $100 million worth of in-house custom programs to produce a real-time snapshot of their positions in hundreds of imaginable scenarios at all times. This is the sort of thing Ray Dalio used to do.
If you want to invest with these guys feel free to do so.
They require a $10-$25 million initial slug of capital, a one-year lock-up, charge a fixed management fee of 2%, and a performance bonus of 20% or more.
You have to show minimum liquid assets of $2 million and sign 100 pages of disclosure documents.
If you have ever sued a previous manager, forget it.
And, oh yes, the best-performing funds have a ten-year waiting list to get in, as with my friend David Tepper. Unless you are a major pension fund like the State of California, they don’t want to hear from you.
Individual investors are not so sophisticated and it clearly shows in their performance, which usually mirrors the indexes with less of a large haircut.
So, I am going to let you in on my own, vastly simplified, dumbed down, the seat of the pants, down-and-dirty style of scenario analysis and stress testing that replicates 95% of the results of my vastly more expensive competitors.
There is no management fee, performance bonus, disclosure document, lock up, or upfront cash requirement. There’s just my token $3,500 a year subscription and that’s it.
To make this even easier for you, you can perform your own analysis in the Excel spreadsheet I post every day in the paid-up members section of Global Trading Dispatch.
You can just download it and play around with it whenever you want, constructing your own best-case and worst-case scenarios. To make this easy, please log into your Mad Hedge Fund Trader, click on “MY ACCOUNT”, then click on Global Trading Dispatch, then Current Positions, and download the Excel spreadsheet for April 25, 2024.
There you will find my current trading portfolio showing:
Current Capital at Risk
Risk On
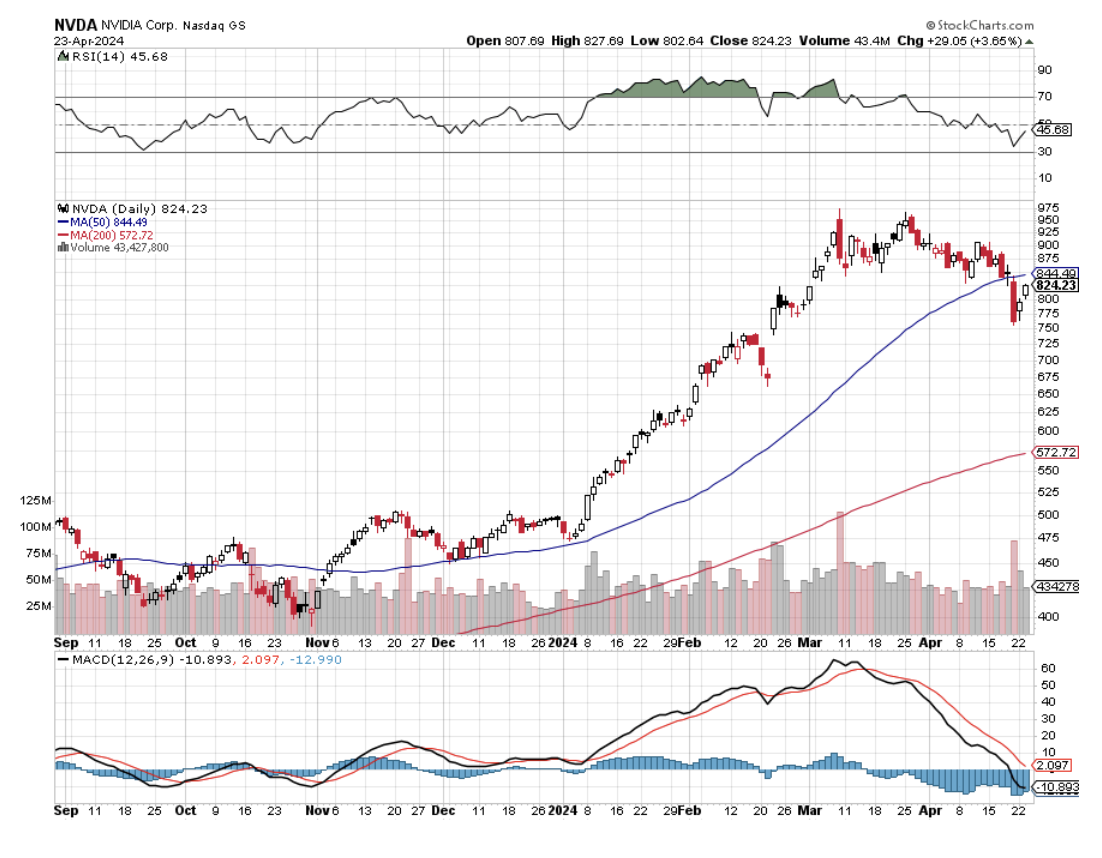
(NVDA) 5/$710-$720 call spread 10.00%
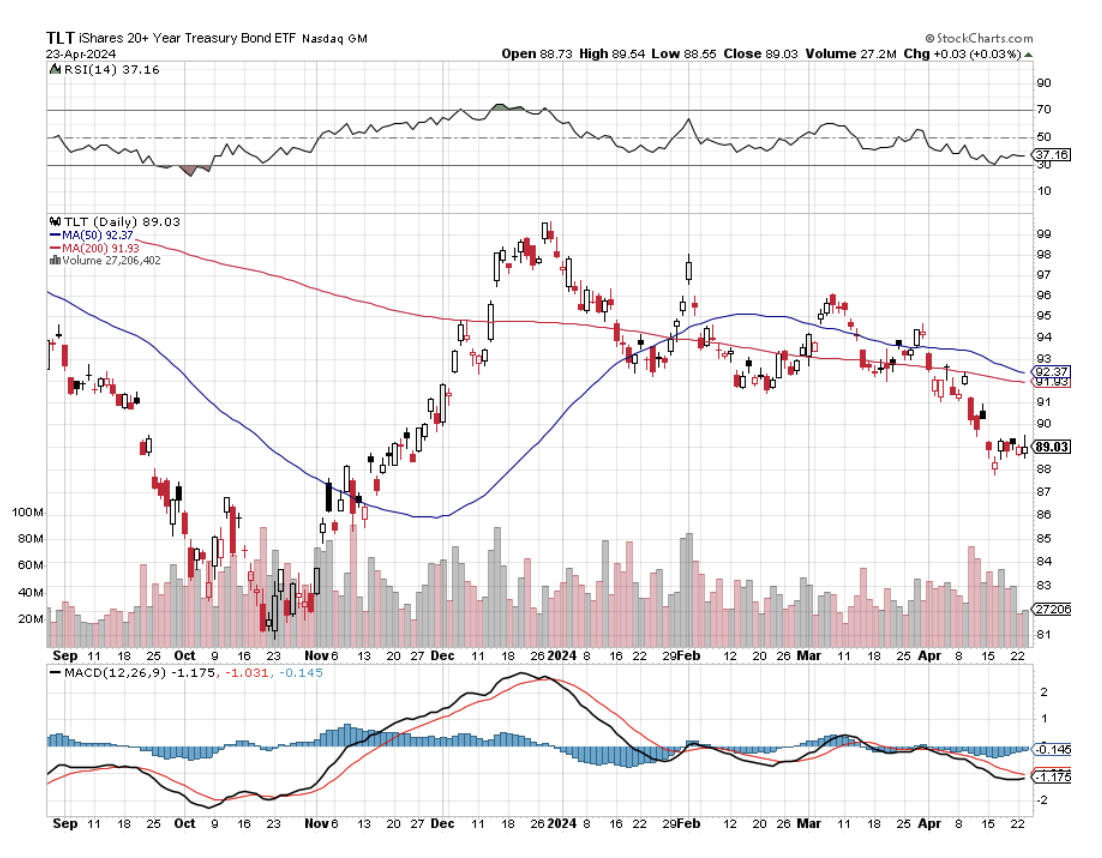
(TLT) 5/$82-$85 call spread 10.00%
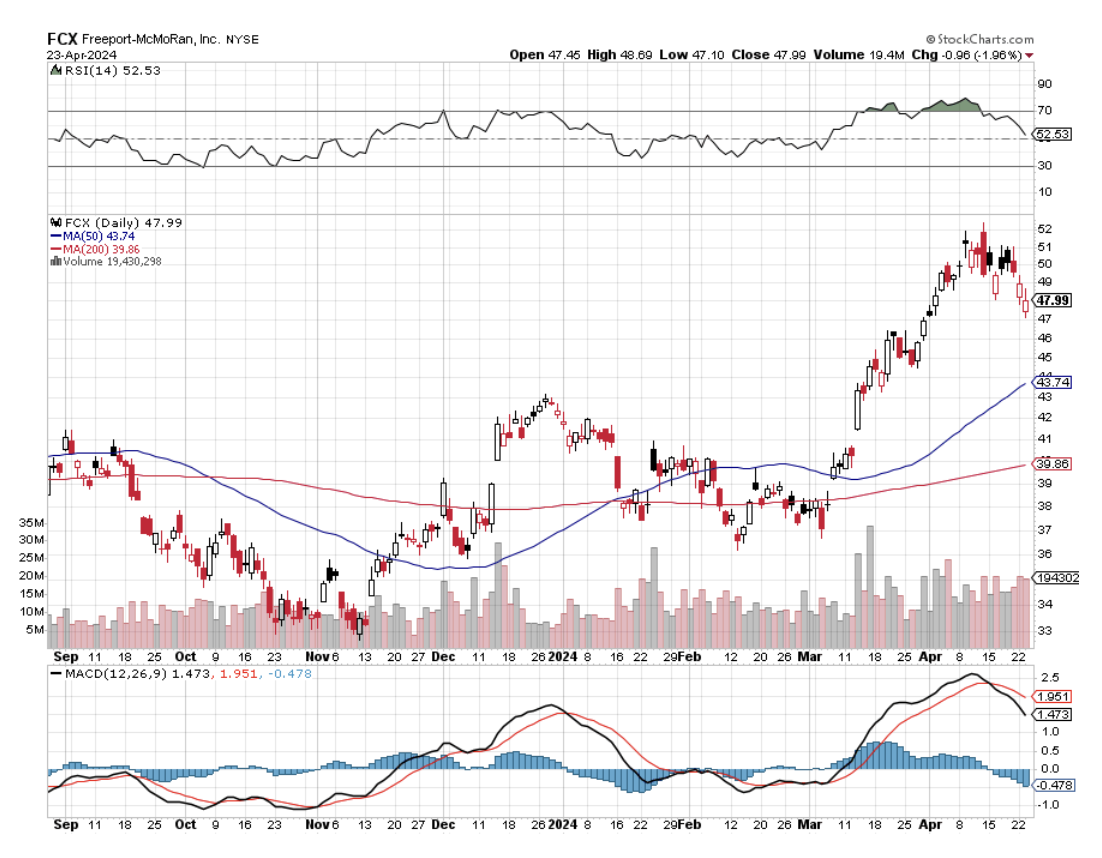
(FCX) 5/$42-$45 call spread 10.00%
Risk Off
(NVDA) 5/$960-$970 put spread -10%
Total Net Position 30.00%
Total Aggregate Position 40.00%
Since this is a “for dummies” explanation, I’ll keep this as simple as possible.
No offense, we all started out as dummies, even me.
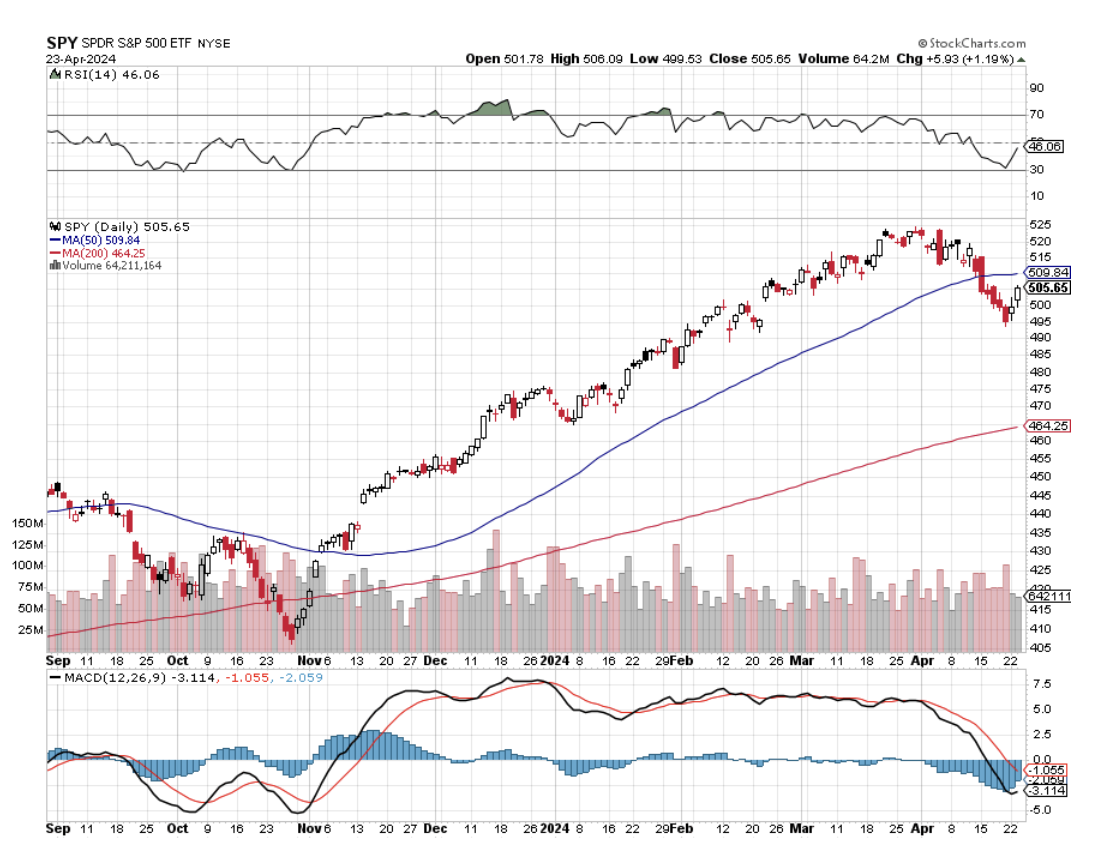
I’ll the returns in three possible scenarios: (1) The (SPY) is unchanged at $505 by the May 17 expiration of my front month option positions, which is 15 trading days away, (2) The S&P 500 rises 5.0% to $530 by then, and (3) The S&P 500 falls 5.0% to $480.
Scenario 1 – No Change
The value of the portfolio rises from a 5.07% profit to a 13.00% Profit. My existing longs in (FCX), (TLT), and (NVDA) expire at their maximum profits. So does my one short in (NVDA).
Scenario 2 – S&P 500 rises to $530
You can easily forget about the long positions in (FCX), (TLT), and (NVDA) as they will expire well in the money. If they go up fast enough, I might even take an early profit and roll into a June or July position. Our short in (NVDA) might take some heat. But in the current environment of going into the summer doldrums, there is no way (NVDA) shoots up to a new all-time high, right where our strike prices were set at on purpose. The net of all this is that our portfolio should expire at a maximum profit for the year at up 13.00%.
Scenario 3 – S&P 500 falls to $480
All three of my stocks fall, but not enough for my three call spreads to go out of the money. (FCX) will stay above my stop-out level at $45, (TLT) at $85, and (NVDA) at $720. Obviously, the short in (NVDA) becomes a chipshot. Again, we expire at a maximum profit for the year at up 13.00%.
Up we make money, down we make money, sideways we make money, I like it! This is why I run long/short baskets of options spreads whenever the market allows me. It’s a “Heads I win, tails you lose strategy”.
If the market goes up, I’m looking for stocks to sell. If the market goes down, I'm looking for securities to buy. Boy low, sell high, I’m thinking of patenting the idea.
This is the type of extremely asymmetric risk/reward ratio hedge funds are always attempting to engineer to achieve outsized returns. It is also the one you want after the stock market has risen by 25% a year since the 2020 pandemic.
All that’s really happened is that the world has gone from slightly good to better this year. I can rejigger this balance anytime I want. If I think that a change in the economy or the Fed’s interest rate policy is in the works.
Keep in mind that these are only estimates, not guarantees, nor are they set in stone. Future levels of securities, like index ETF’s are easy to estimate. For other positions, it is more of an educated guess. This analysis is only as good as its assumptions. As we used to do in the computer world, garbage in equals garbage out.
Professionals who may want to take this out a few iterations can make further assumptions about market volatility, options implied volatility or the future course of interest rates. Keep the number of positions small to keep your workload under control. I never have more than ten. Imagine being at Goldman Sachs and doing this for several thousand positions a day across all asset classes.
Once you get the hang of this, you can start projecting the effect on your portfolio of all kinds of outlying events. What if a major world leader is assassinated? Piece of cake. How about another 9/11? No problem. Oil at $150 a barrel? That’s a gimme. What if there is an Israeli attack on Iranian nuclear facilities? That might take you all of two minutes to figure out. The Federal Reserve launches a surprise interest rate rise? I think you already know the answer.
The bottom line here is that the harder I work, the luckier I get.