September 23, 2024

(MORE DATA RELEASES THIS WEEK AS THE MARKET DIGESTS THE 50bps NUMBER)
September 23, 2024
Hello everyone,
WEEK AHEAD CALENDAR
Monday, Sept. 23
8:30 a.m. Chicago Fed National Activity Index (August)
9:45 a.m. PMI Composite preliminary (September)
9:45 a.m. Markit PMI Manufacturing preliminary (September)
9:45 a.m. Markit PMI Services preliminary (September)
Tuesday, Sept. 24
9:00 a.m. FHFA Home Price Index ((July)
9:00 a.m. S&P/Case Shiller comp. 20 HPI (July)
10:00 a.m. Consumer Confidence (September)
10:00 a.m. Richmond Fed Index (September)
12:30 a.m. Australia Rate Decision
Previous: 4.35%
Forecast: 4.35%
Earnings: AutoZone
Wednesday, Sept 25
10:00 a.m. New Home Sales (August)
7:50 p.m. Japan BoJ Minutes
Earnings: Micron Technology
Thursday, Sept. 26
8:30 a.m. Continuing Jobless Claims (09/14)
8:30 a.m. Durable Orders ex-Transportation (August)
8:30 a.m. GDP (Q2)
8:30 a.m. Initial Claims (09/21)
9:20 a.m. US Fed Chair Speech
10:00 a.m. Pending Home Sales Index (August)
11:00 a.m. Kansas City Fed Manufacturing Index (September)
Earnings: Costco Wholesale, CarMax
Friday, Sept 27
8:30 a.m. PCE Deflator (August)
8:30 a.m. Core PCE Deflator (August)
8:30 a.m. Personal Consumption Expenditure (August)
Previous: 2.5%
Forecast: 2.4%
8:30 a.m. Personal Income (August)
8:30 a.m. Wholesale Inventories preliminary (August)
10:00 a.m. Michigan Sentiment final (September)
We’ve got a lot of data points to get through this week.
Consumer confidence in September is expected to have weakened. And that is really expected to be the overall theme in most data – weakness over strength, thereby giving validity to the Fed’s decision to go 50bps last week.
The Fed’s preferred inflation gauge, the August personal consumption expenditure price index that’s due out Friday is expected to show pricing pressures continuing to pull back from their highs. No doubt, this piece of data may well guide the Fed’s decision on the magnitude of rate cuts come November.
So, back to the rate cut theme, and we saw that the Bank of England maintained its steady course, keeping rates unchanged as August inflation figures failed to show further decline.
On Tuesday, the Reserve Bank of Australia meets. Rates are expected to remain unchanged. This comes amid a strengthening Aussie dollar, with AUD/USD closing at its highest level since January above 0.6800.
If you listen to the media, you will hear all the jibber jabber about the DOW reaching 42,000 for the first time and whether the market can continue to climb. (They are paid to talk, but you are not paid to listen! Take it all with a grain of salt). In other words, receive the information (if you watch/listen to T.V.) with some reservation as all of it may not be entirely credible.
You will also hear the many arguments explaining why the Fed went so big, and what the effects of that will be going forward, and into next year, and what the Fed will do in November and December.
Shut out all that noise. It tends to create confusion, rather than clarity.
The S&P500 is on track to reach the target I gave you many months ago – 5,745. And it will probably rally beyond that target going into year-end.
Next year may be a different story.
We may have many months of sideways movements, and quite possibly an extreme sell-off at some stage.
That sell-off, if it does take place, would create an excellent opportunity to scale into great stocks at cheap prices.
I will keep you up to date with my interpretation of the markets going forward.
But, for now, let’s stick to the present.
MARKET UPDATE
S&P500
Uptrend in progress. The September 6th low of 5403 can be interpreted as a completed corrective Wave ii of 5 and the market can now continue rallying within Wave iii of 5 toward a target of around 6,260.
GOLD
Uptrend continues. The bullish structure is intact. Support = $2,600/$2,590. Next target = $2,670.
BITCOIN
Advance in progress. Bitcoin completed a complex correction on its August 5th low of $49,577. Now in its Wave 3 advanced toward a target of around $73,830. Support = $62,500/$61,330.
Next targets = $65,000, $68,650/$70,000
CONFLICTS CORNER

AUSTRALIAN CORNER
Housing affordability falls to the worst level on record.
Housing research group Prop Track’s annual Housing Affordability Index reveals the worst conditions for homebuyers on record as continued property price increases and decade-high interest rates remain stubborn.
The analysis found that a median-income household earning $112,000 annually could afford only 14% of all the homes sold last financial year, the smallest share since records began in the 1194-95 financial year.
Just three years ago, the same household could have comfortably purchased 43% of houses or units.
Property prices rose 6.6% nationally over the year to June, the equivalent of a %50,000 increase. The average first-home buyer household now must set aside a fifth of their income for 5.6 years to save a standard 20% deposit for the median home.
PropTrack economist Angus Moore comments that we are on “par with the last period of challenging affordability in 2008 and mortgage repayments today are only a little bit below what they were in the late 1980s and early ‘90s as a share of income.”
Low-income households are effectively locked out of the market, able to buy three in 100 homes.
Yellow Brick Road Home Loans executive chairman Mark Bouris says the reality is many millennials and Gen Zs will not be able to get a mortgage.
Sydney’s median home price is $1.5 million. Tasmania is now close behind. Just six years ago, Tasmania was the most affordable state. Victoria is a close third, with 12% of homes sold last year requiring 25% or less of pre-tax income to meet repayments,
South Australia experienced the most significant decline in affordability over the past year, with 16% of homes available to the state’s average earner.
Western Australia offers the best affordability, with more than a quarter of homes sold last year deemed affordable, followed by Queensland with 15% of properties.
Some relief is on the horizon. Major banks are forecasting rate cuts next year, which has the potential of returning hundreds of dollars into the pockets of mortgage holders each month and boosting new borrower’s limits.
Mr Bouris said it was unfair to lay blame for worsening affordability squarely at the feet of the RBA. He believes the federal government’s lax immigration policies, the state’s reliance on stamp duty revenues, and poor council planning all play a part in Australia’s housing crisis.
WHAT IS…?

Private equity funds are designed to generate enhanced returns by pooling investors’ capital and investing in private companies to drive business growth, streamline operations, and/or support acquisitions.
Investors provide private equity fund managers with the capital needed to invest in strategically identified companies. Unlike public equity managers, private equity managers actively seek to work with management teams to improve companies with the goal of eventually selling shares at a profit and distributing those profits to investors. In return, fund managers receive a management fee, and a share of the returns generated by the fund, further incentivizing value creation and aligning the interests of fund managers, investors, and company management teams.
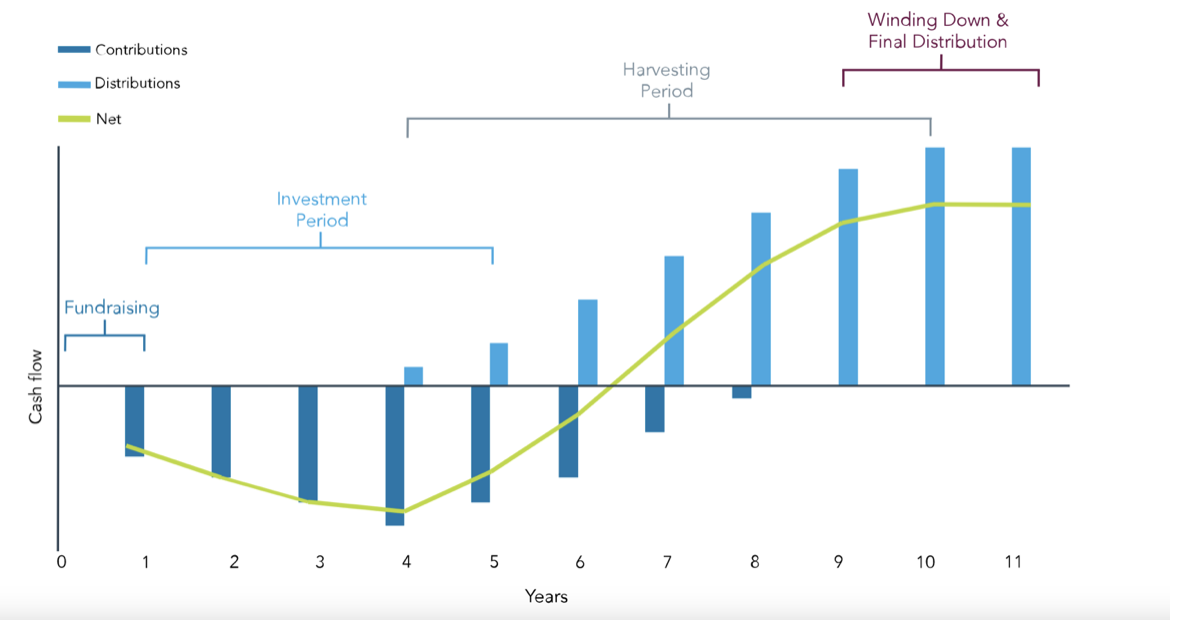
Life Cycle of a Fund
1/ Fundraising – finding investors & gathering commitments.
2/ Investment Period – identifying & investing in companies.
3/ Harvesting Period – creating value, exiting companies & distributing profits.
4/ Winding down & final distribution – exiting remaining positions.
Sample Life Cycle of a Private Equity Fund
Benefits:
Historically, private equity generates long-term outperformance relative to the public markets.
Private equity provides access to a larger investment circle with more opportunities than the public markets.
Private equity managers aim to create value by taking a long-term view, which can help reduce risk, particularly in uncertain markets.
A private equity allocation can provide enhanced return potential and diversification benefits (i.e. uncorrelated investment exposure in a portfolio).
Risk Considerations:
Private equity funds are considered long-term investments, typically with terms of seven to ten years.
Fees: equity fund managers usually charge an annual management fee of 1-2% of assets under management. They also collect performance fees, which can range from 10-20% of any value appreciation generated by the fund.
Private equity funds may use some form of leverage, which offers the potential for higher returns, cut also increases the downside risk.
Private equity funds may not be as transparent as traditional investments, which are required to provide frequent and full disclosures.
QI CORNER
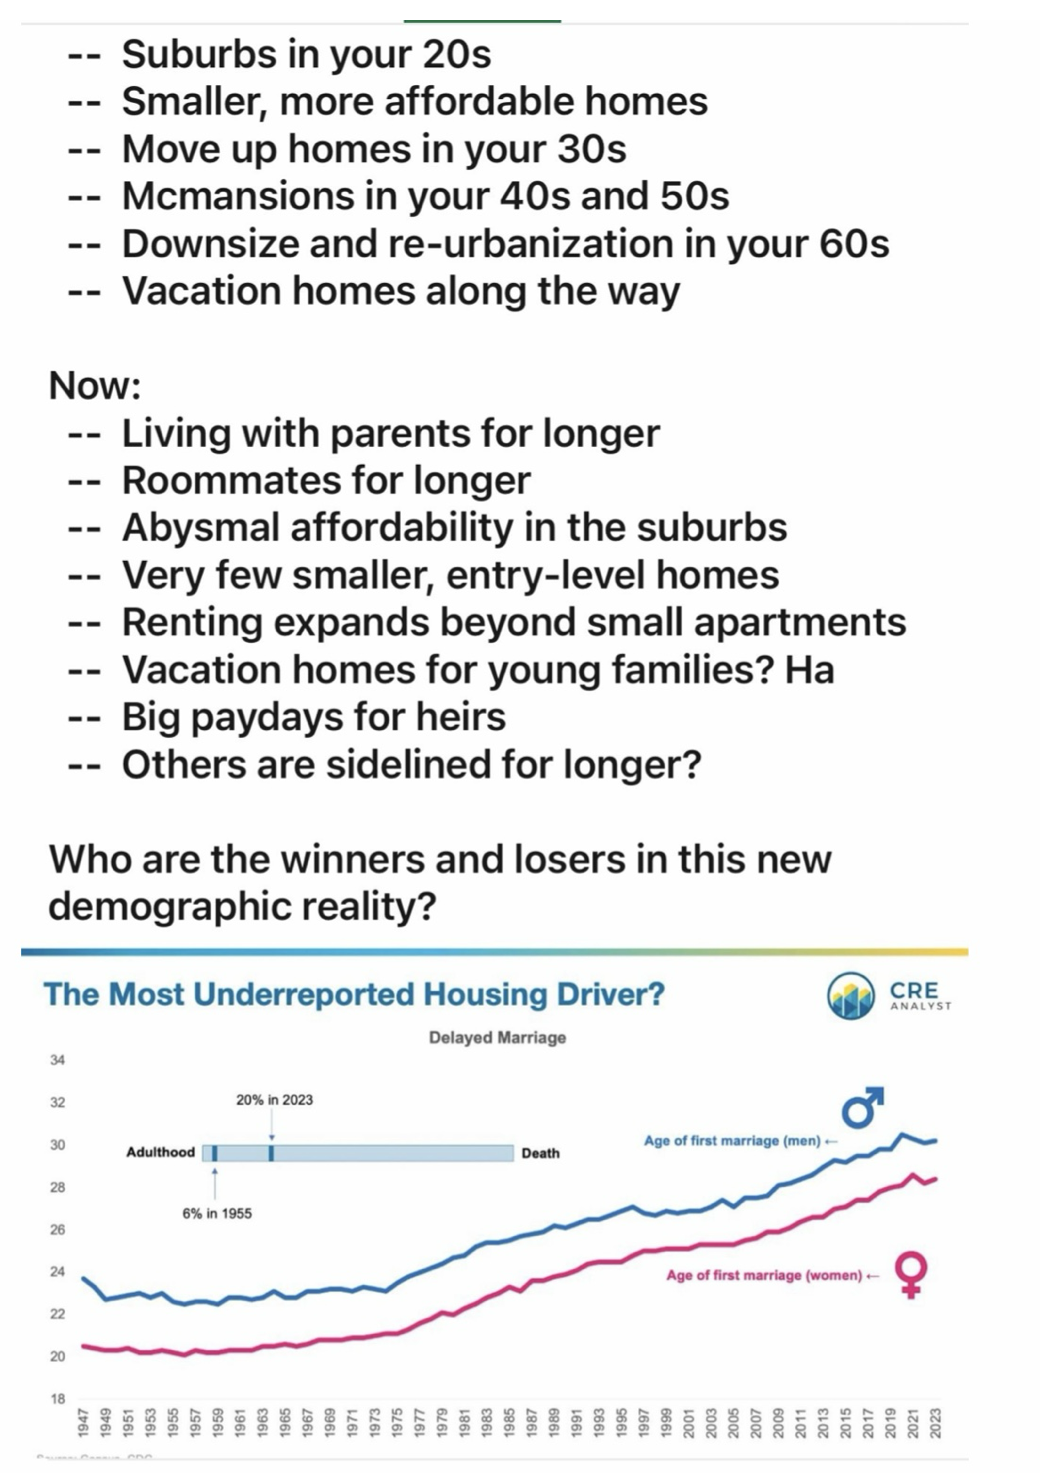
We are witnessing a cultural shift in the average age of marriage and overall marriage rates, couples with the challenges of high entry-level home prices and mortgage interest rates. As a result, many young individuals are opting to rent for more extended periods of their lives. This trend may signal the beginning of a new era where North Americans embrace lifelong renting, akin to many European countries.
The evolving dynamics in marriage and housing choices are likely to have intriguing implications for different real estate asset classes investment returns over the next decade.
(Ross W. McBride, Experienced Real Estate Investment Professional)
SOMETHING TO THINK ABOUT


Cheers,
Jacquie